by Vivek | Apr 1, 2020 | Forex Trade Ideas, USDCAD
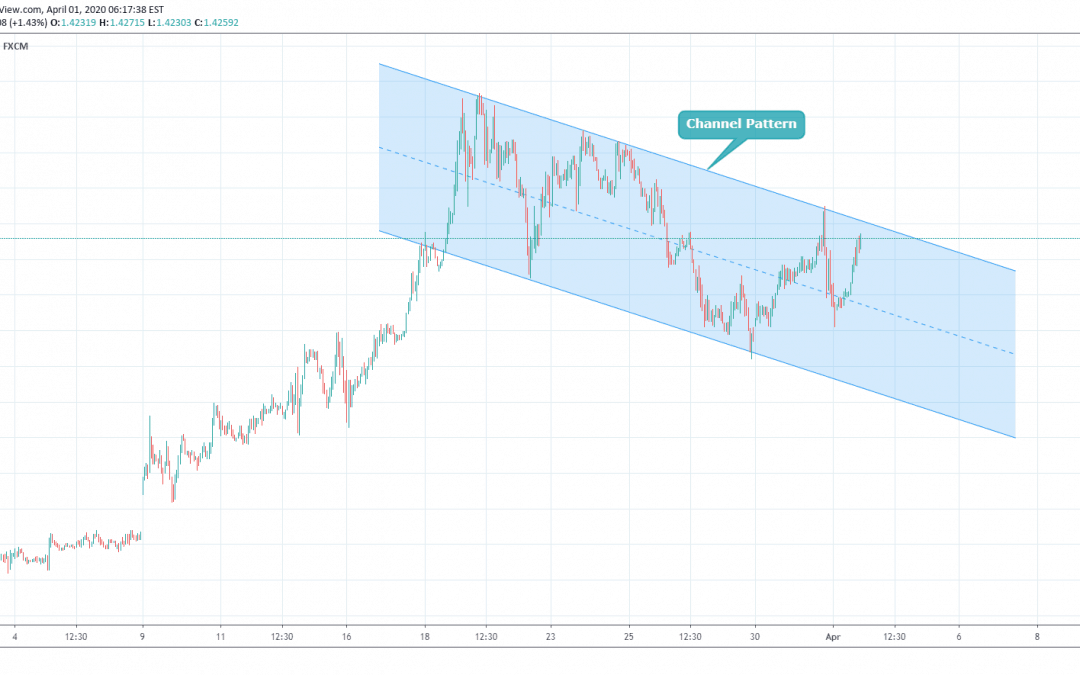
USDCAD is trading in Channel pattern after it makes top from its previous bottom. If anyone wants to take the short term trade one can trade either long or short with channel line support and resistance respectively. Like/Comment/Follow Us For More IdeaNote –...
by Ryan Lopes | Mar 30, 2020 | Forex Trade Ideas, USDCAD
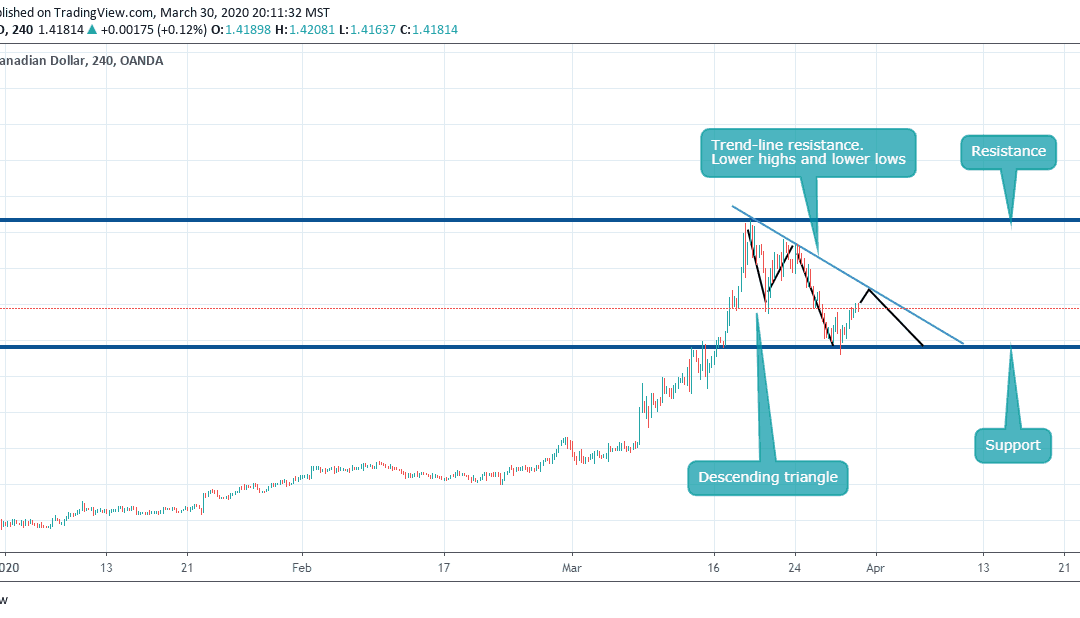
Hello fellow traders, hope you all are having a good day! Here is our analysis on USDCAD . We have given two charts, one of H1 and the other of D1. In the D1 chart we have shown you the support and resistance line. (see our comment section). Now, as we come to our H1...
by Vivek | Mar 27, 2020 | Forex Trade Ideas, USDCAD
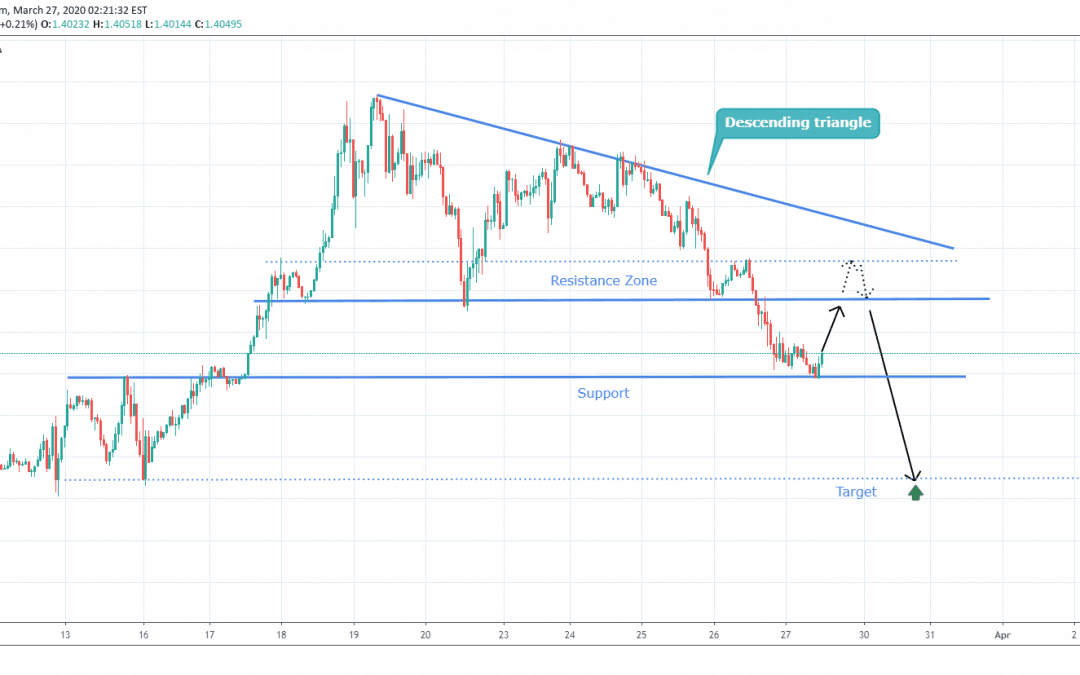
USDCAD has given a breakout from descending triangle pattern which is classic bearish pattern or it is indicate trend reversal as you can see in chart it has taken support @1.3995 and it will move towards the resistance zone for price correction and again it might...
by Ryan Lopes | Mar 26, 2020 | Forex Trade Ideas, USDCAD
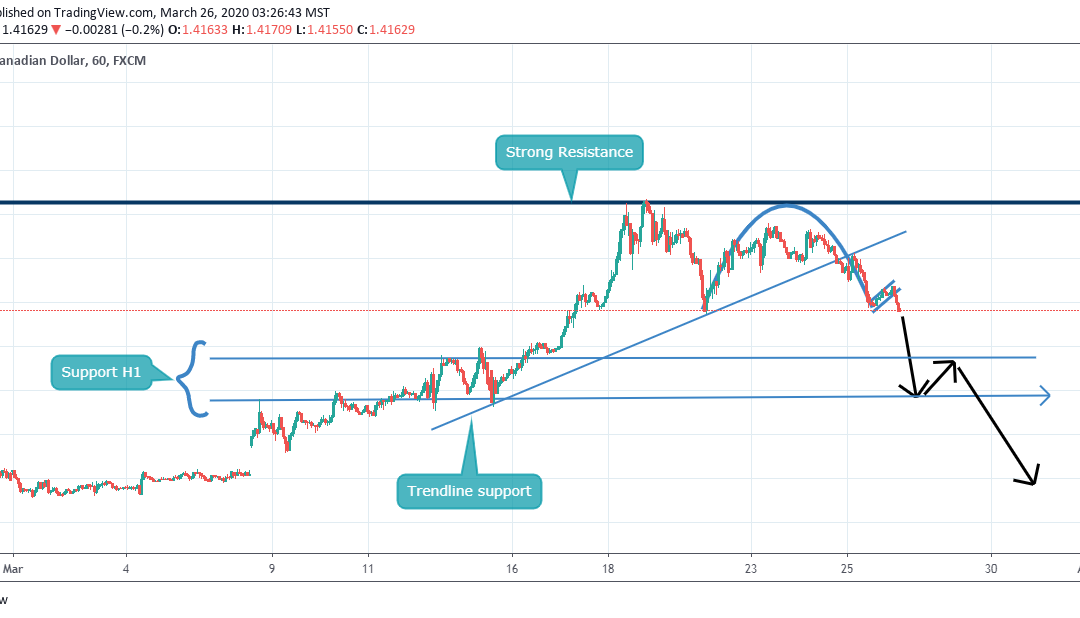
Hello traders, hope everyone out there are doing good. Here is our analysis on USDCAD . The pair did hit the strong resistance after which it started going down. After sometimes it came back a bit up and stared going down again forming a CUP and HANDLE chart pattern....
by Rishikesh Lilawat | Mar 24, 2020 | Forex Trade Ideas, USDCAD
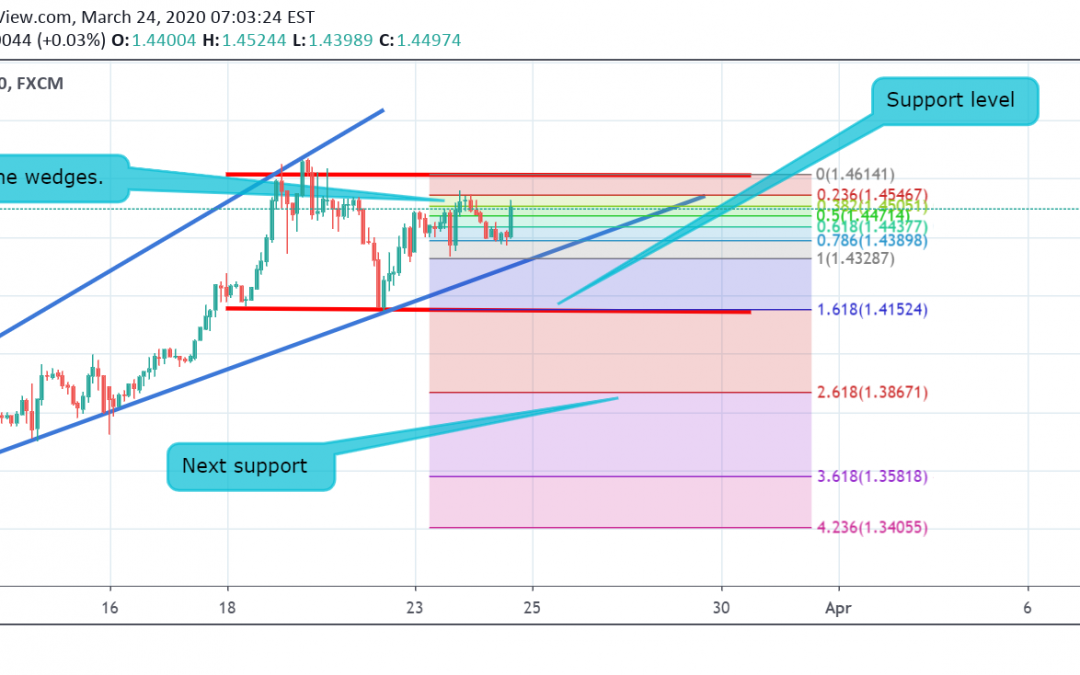
Currently the price is at 1.4503 it is hovering in the range of 1.4614 to 1.4152, which is its support and resistance range. If the price breaches the support level after reversing back from resistance, then it may enter into a down trend and then its nearest support...
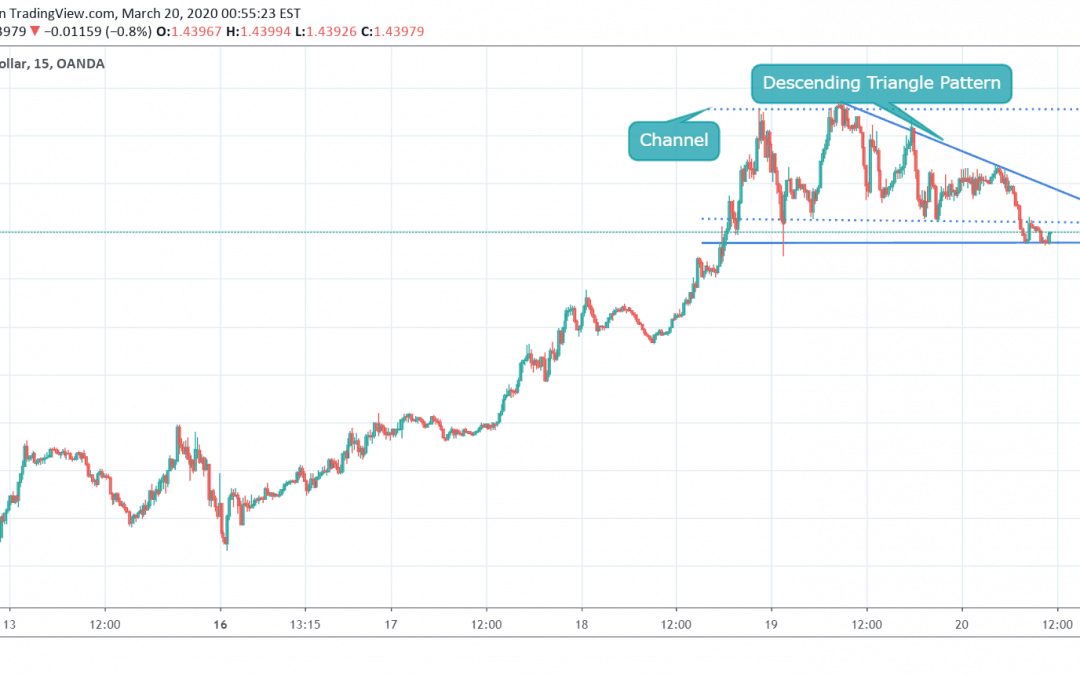
by Vivek | Mar 20, 2020 | Forex Trade Ideas, USDCAD
USDCAD is trading at top and it is forming a descending triangle pattern which is sign for trend reversal if it breaks from the descending triangle pattern we may see further down side in USDCAD but as up trend was strong in USDCAD it may consolidate in channel for...


