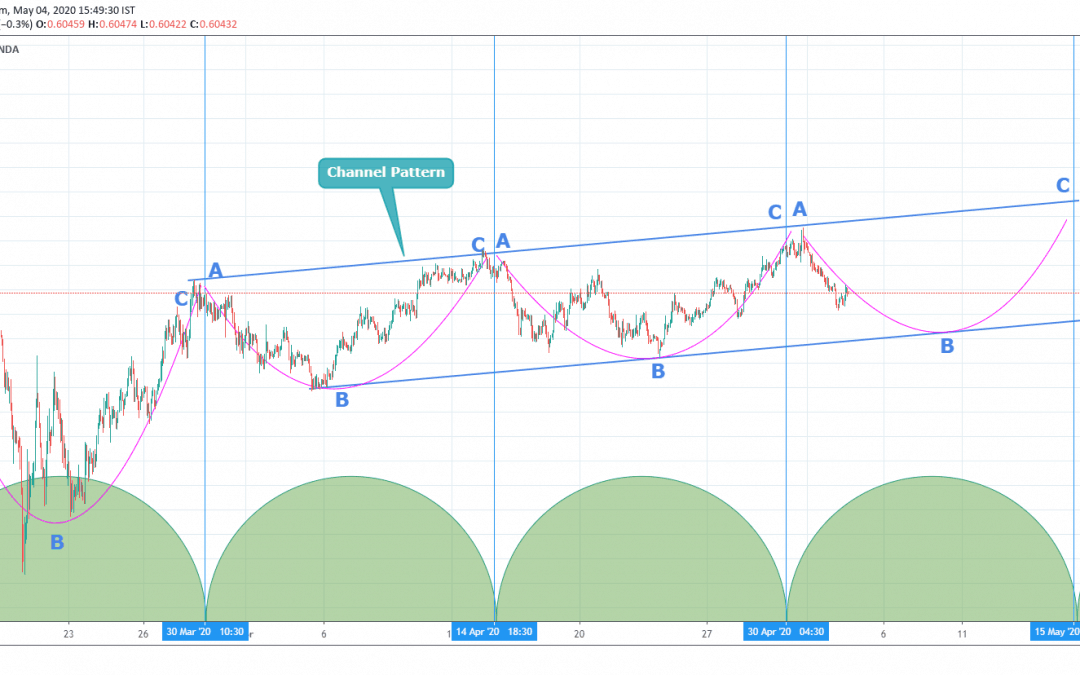
NZDUSD is trading according to the time cycle (as you can see in the chart). NZDUSD is also trading in a channel pattern moreover it is trading in a synchronize pattern with the time cycle. At the beginning of time cycle, price is at high point A or at the resistance of channel pattern (as you can see in chart), in the middle of time cycle it is trading at lowest point B or the support line of Channel Pattern and at end of time cycle price is again moving towards the resistance line of channel pattern, which is point C. So, according to the pattern, we might see NZDUSD may move downside towards the Support of channel pattern.
If You Like Idea Do Follow/Comment/Like For More Quick Update As Time Is Money.
Note Trade With Proper Risk Management System.
Thanks