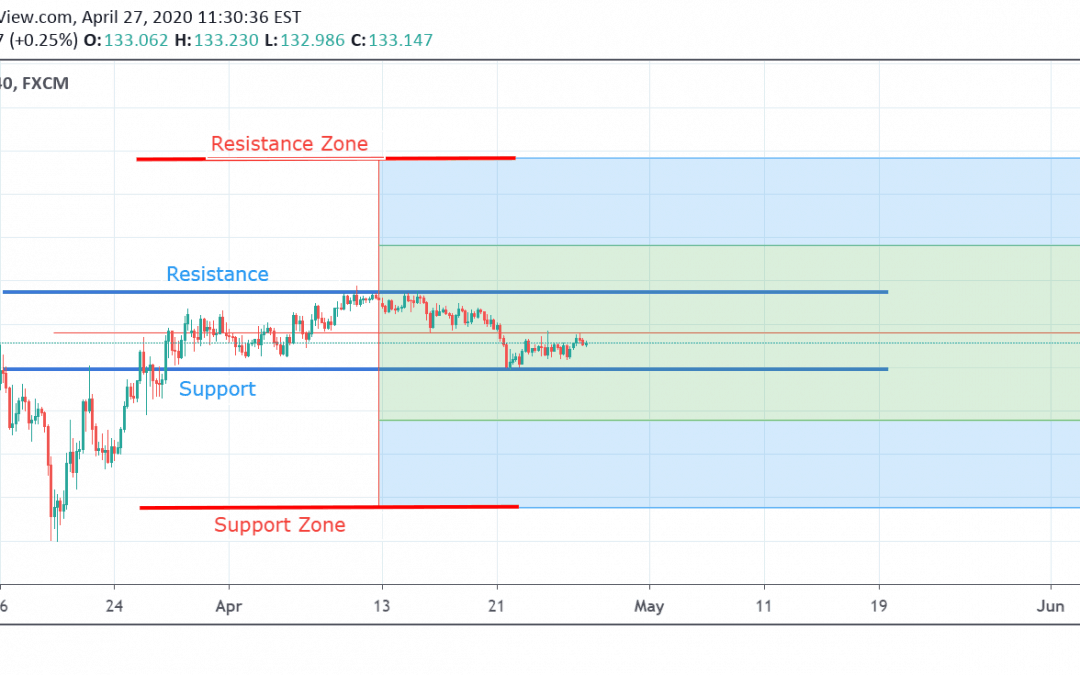
by Rishikesh Lilawat | Apr 27, 2020 | Forex Trade Ideas, GBPJPY
Currently, GBP/JPY is trading at 133.15. The pair started a sideways trend on 12 April after rebounding from the resistance level and now the price is consolidating in the resistance and support wedges . If the price breaks the resistance level at 135.45, then it may...
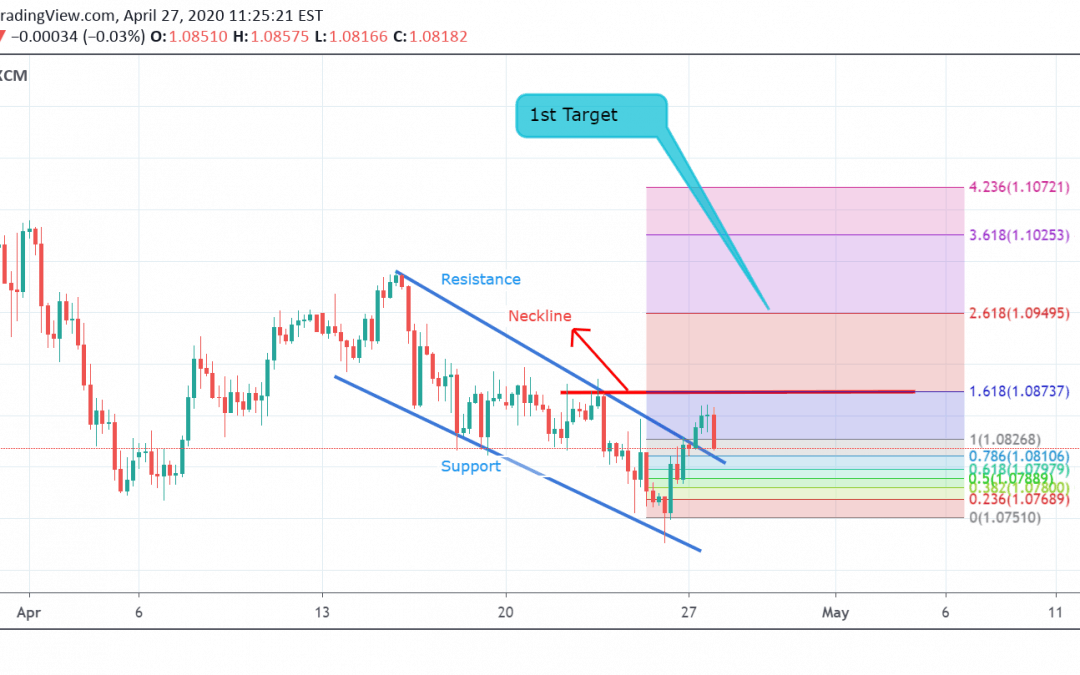
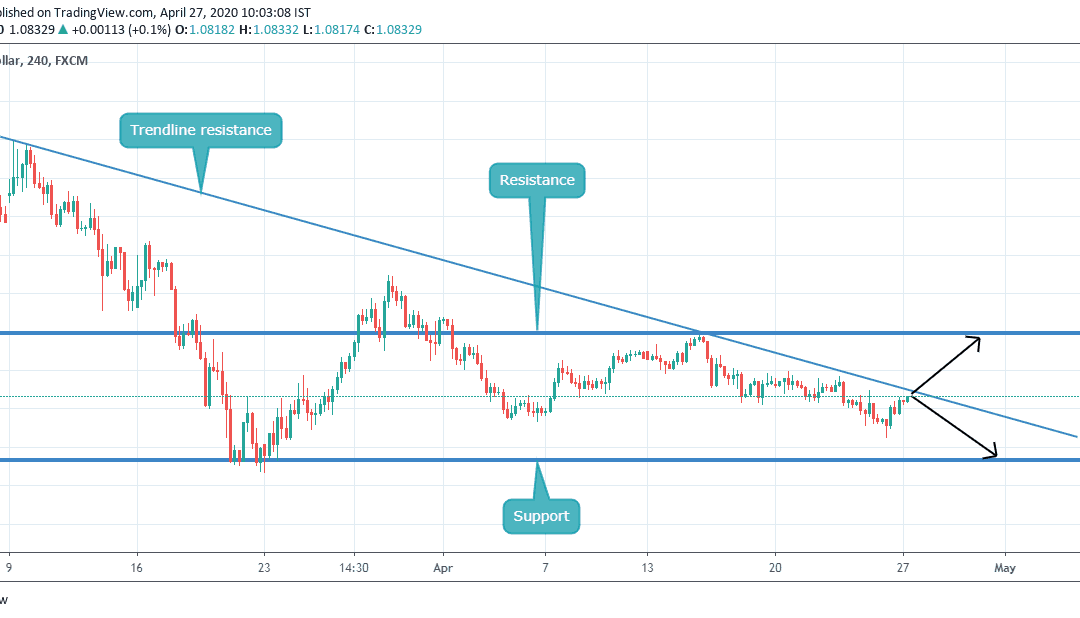
by Rishikesh Lilawat | Apr 27, 2020 | EURUSD, Forex Trade Ideas
Currently, EUR/USD is trading at 1.0816. The pair started trading in uptrend after breaching resistance on 27 April, and now they are moving towards neckline. If the price breaks its neckline at 1.0873, then it may start a strong uptrend and can touch the...
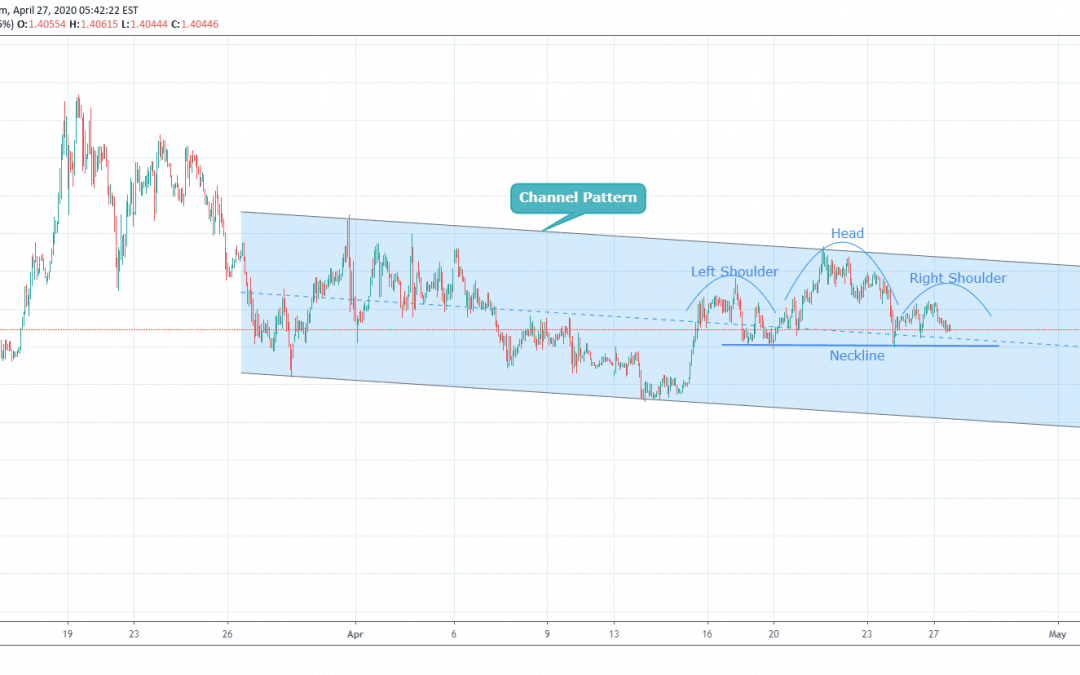
by Vivek | Apr 27, 2020 | Forex Trade Ideas, USDCAD
USDCAD has given a good breakout from falling trendline from its top. Now it is trading in channel pattern, as you can see in the chart. Within the channel pattern, it is forming head and shoulder pattern, which is a trend reversal pattern, so we might think it will...
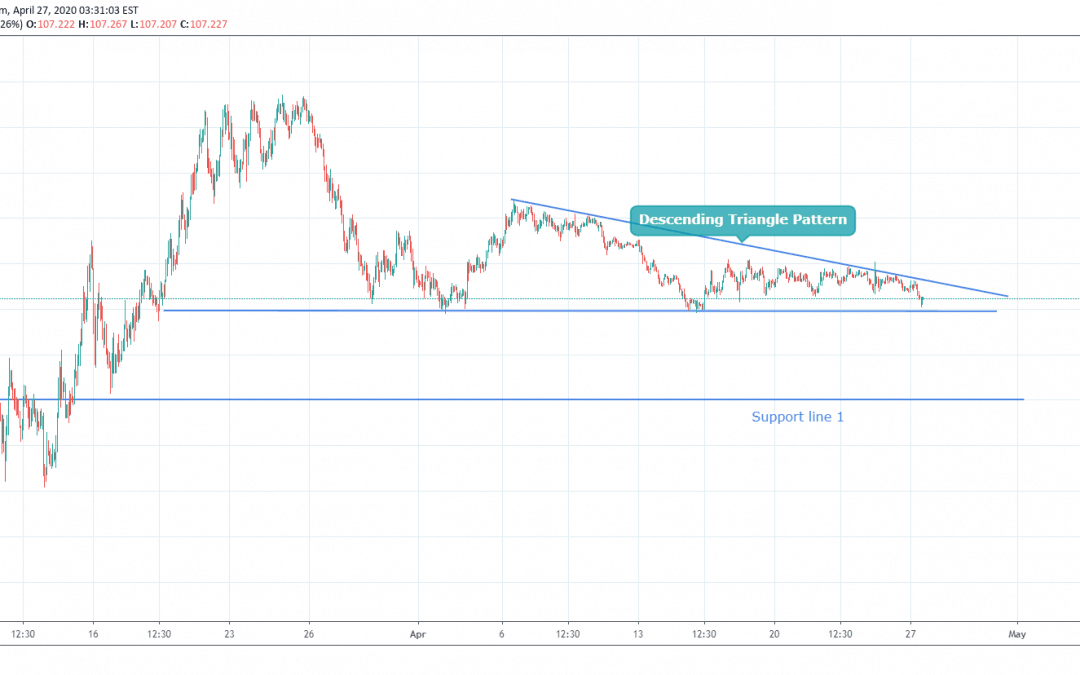
by Vivek | Apr 27, 2020 | Forex Trade Ideas, USDJPY
USDJPY is trading in the Descending Triangle pattern. If it breaks out from the descending triangle pattern, we might see further downside on USDJPY towards support line 1. One can initiate the trade on USDJPY on the breakout of the Descending Triangle pattern only....
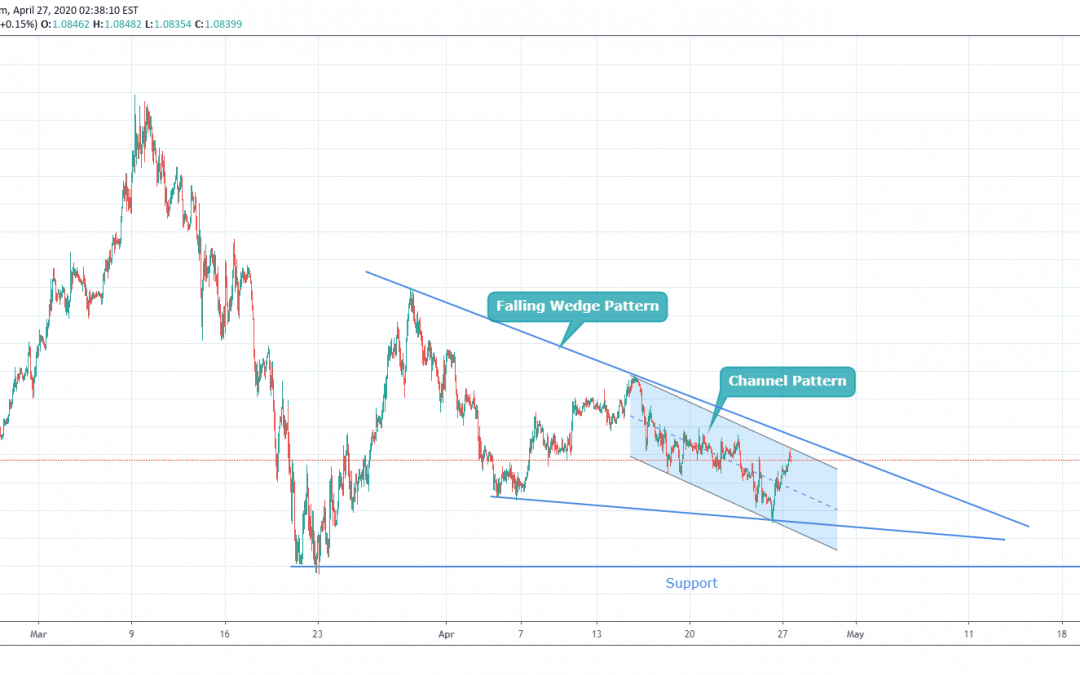
by Vivek | Apr 27, 2020 | EURUSD, Forex Trade Ideas
EURUSD is trading in a falling wedge pattern in a bigger trend, within the falling wedge , it is also trading in channel pattern. We might see more downside in EURUSD from the current level. As we can see, the falling wedge resistance line and parallel...
by Ryan Lopes | Apr 26, 2020 | EURUSD, Forex Trade Ideas
Hello my fellow traders, hope you all are making some profits. We are here with our new analysis so that we can increase those profits for you. Let’s get into the analysis. As we can see, the pair is at the resistance point. One should wait for confirmation. Let us...

 Why Scalpers Love 4XVision: A Deep Dive …January 18, 2026Scalping is one of the most demanding styles of Forex […]
 Using 4XVision in Volatile Markets: How …January 18, 2026Volatility is the heartbeat of the Forex market — […]
 Behind the Dashboard: How 4XVision Build…January 18, 2026In today’s fast-moving Forex landscape, […]
 4XVision: Trading Smarter with Cutting-E…October 29, 2025In Forex trading, every second matters. That’s why […]
 Behind the Screens: The Tech That Powers…October 29, 2025Trading moves fast. Decisions happen in seconds, and […]
 Top 5 Forex Trading Strategies That Actu…August 13, 2025Trade smarter. Stay ahead. Win consistently. Forex […]
 Unlocking Profitable Insights with 4XVis…February 21, 2025In today’s fast-paced Forex market, having access to […]
 BVQ Matrix: Transforming Forex Trading S…February 21, 2025Master the Forex Market with the Power of the BVQ Matrix – Precision, Profit, and Performance. […]