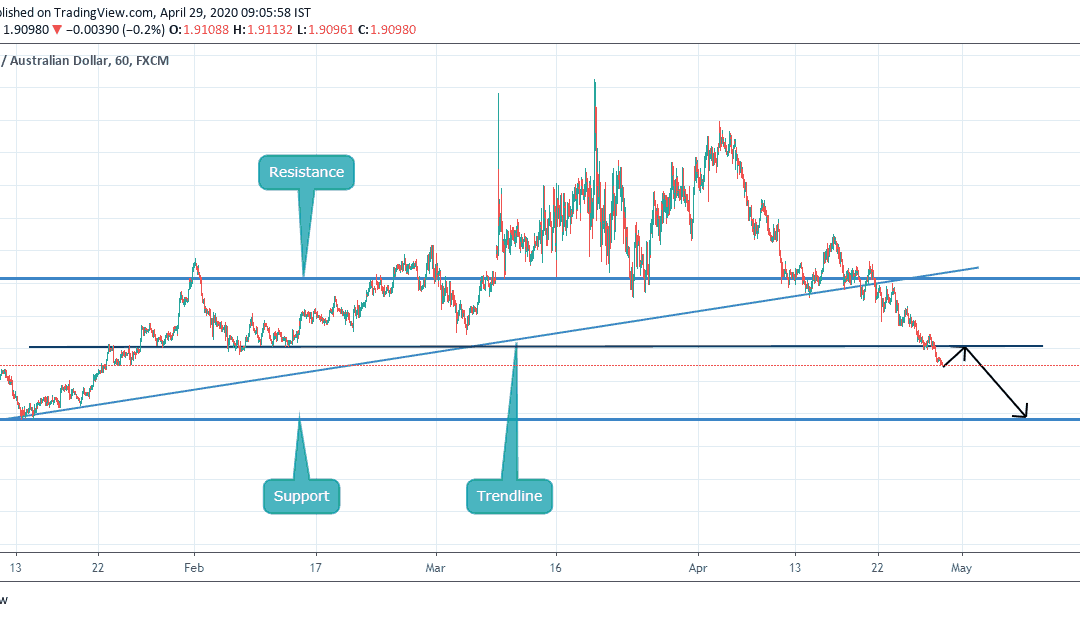
by Ryan Lopes | Apr 28, 2020 | Forex Trade Ideas, GBPAUD
Hello my fellow traders, hope you all are making some profits. We are here with our new analysis so that we can increase those profits for you. Let’s get into the analysis. As we can see, the pair gave a breakout from trendline and its heading towards support Let us...
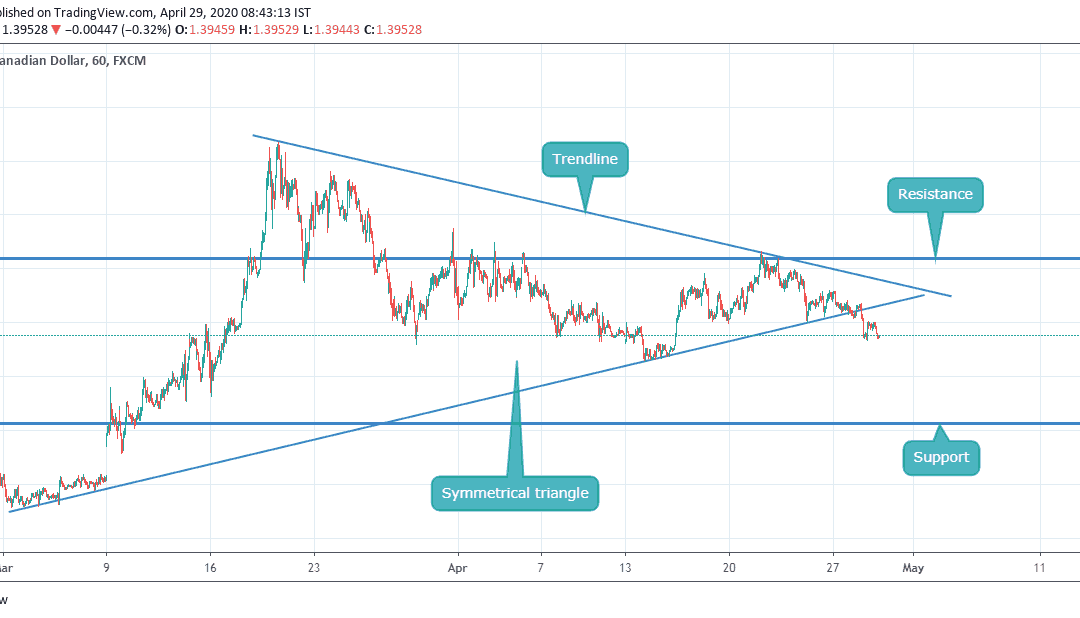
by Ryan Lopes | Apr 28, 2020 | Forex Trade Ideas, USDCAD
Hello my fellow traders, hope you all are making some profits. We are here with our new analysis so that we can increase those profits for you. Let’s get into the analysis. As we can see, the pair gave a breakout from its symmetrical triangle. As per our analysis it...
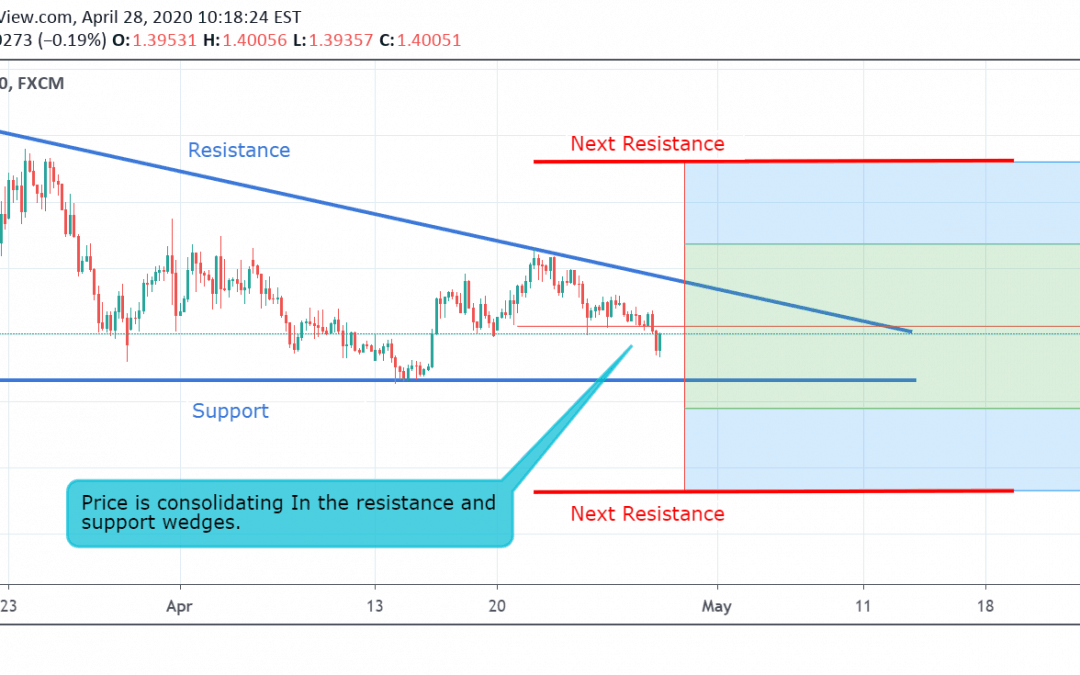
by Rishikesh Lilawat | Apr 28, 2020 | Forex Trade Ideas, USDCAD
Currently, USD/CAD is trading at 1.4004. The pair started a sideways trend on 21 April and now the price is consolidating in the resistance and support wedges . If the price breaks the resistance level at 1.4124, then it may touch its next resistance level at 1.4525....
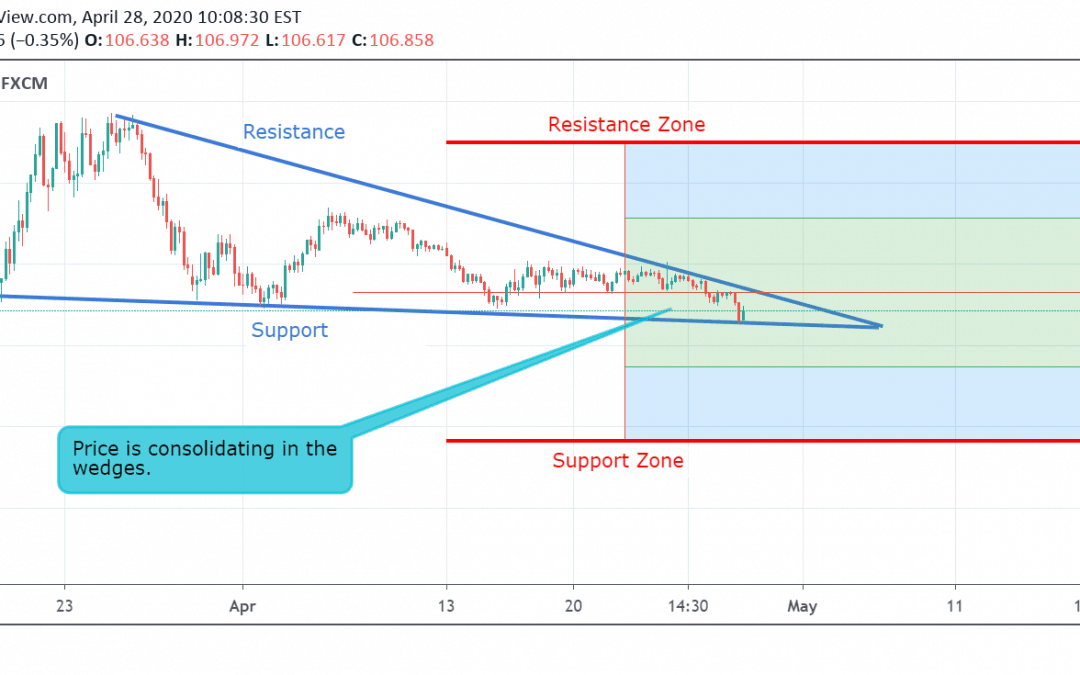
by Rishikesh Lilawat | Apr 28, 2020 | Forex Trade Ideas, USDJPY
Currently, USD/JPY is trading at 106.87. The pair started a sideways trend on 17 April and now the price is consolidating in the descending triangle wedges . If the price breaks the resistance level at 107.93, then it may touch its resistance zone at 111.00. Although,...
by Vivek | Apr 28, 2020 | Forex Trade Ideas, USDCHF
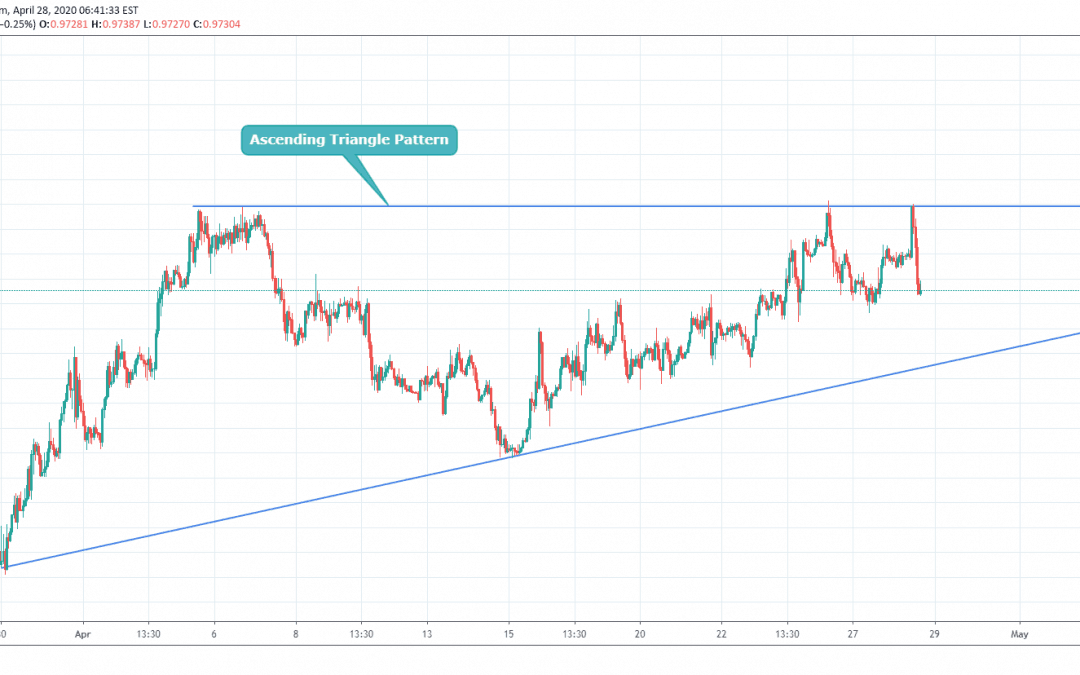
USDCHF is trading in an ascending triangle pattern, which is a bullish pattern . It has tested the resistance line of the ascending triangle the third time and reverse from that point. We might see, the price level will come down to the support line of the ascending...
by Vivek | Apr 28, 2020 | Forex Trade Ideas, NZDJPY
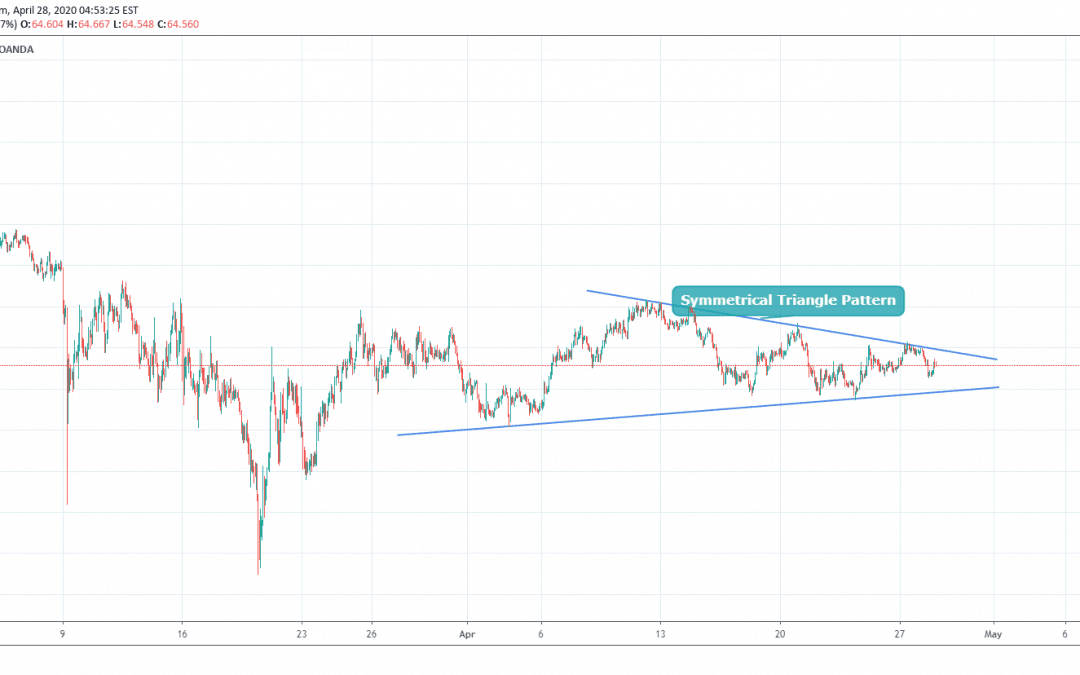
NZDJPY is trading in a symmetrical triangle pattern , which indicates the uncertainty of trend. One can take a trade on a breakout from the symmetrical triangle pattern on either side for the long term. If You Like Idea Do Follow/Comment/Like For More Quick Updates As...

 Why Scalpers Love 4XVision: A Deep Dive …January 18, 2026Scalping is one of the most demanding styles of Forex […]
 Using 4XVision in Volatile Markets: How …January 18, 2026Volatility is the heartbeat of the Forex market — […]
 Behind the Dashboard: How 4XVision Build…January 18, 2026In today’s fast-moving Forex landscape, […]
 4XVision: Trading Smarter with Cutting-E…October 29, 2025In Forex trading, every second matters. That’s why […]
 Behind the Screens: The Tech That Powers…October 29, 2025Trading moves fast. Decisions happen in seconds, and […]
 Top 5 Forex Trading Strategies That Actu…August 13, 2025Trade smarter. Stay ahead. Win consistently. Forex […]
 Unlocking Profitable Insights with 4XVis…February 21, 2025In today’s fast-paced Forex market, having access to […]
 BVQ Matrix: Transforming Forex Trading S…February 21, 2025Master the Forex Market with the Power of the BVQ Matrix – Precision, Profit, and Performance. […]