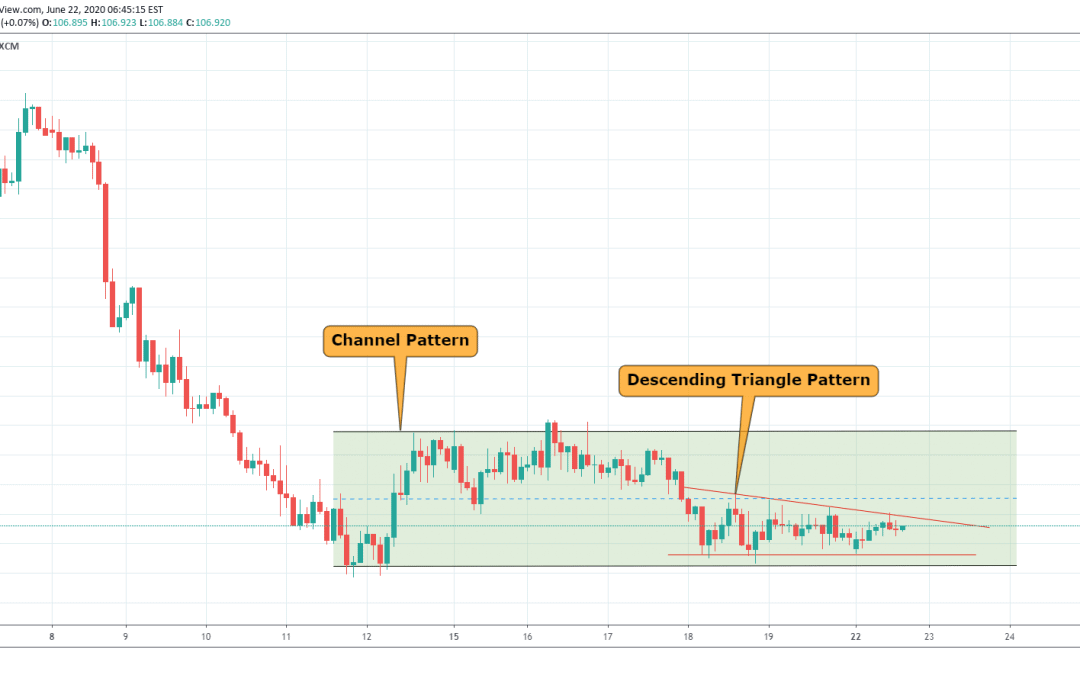
by Vivek | Jun 22, 2020 | Forex Trade Ideas, USDJPY
USDJPY is trading in channel pattern after the movement of the big downside. It has also formed a bearish Descending Triangle Pattern, within the channel pattern, as shown in the chart. Soon, we might see a breakout of a bearish pattern . One can initiate the trade on...
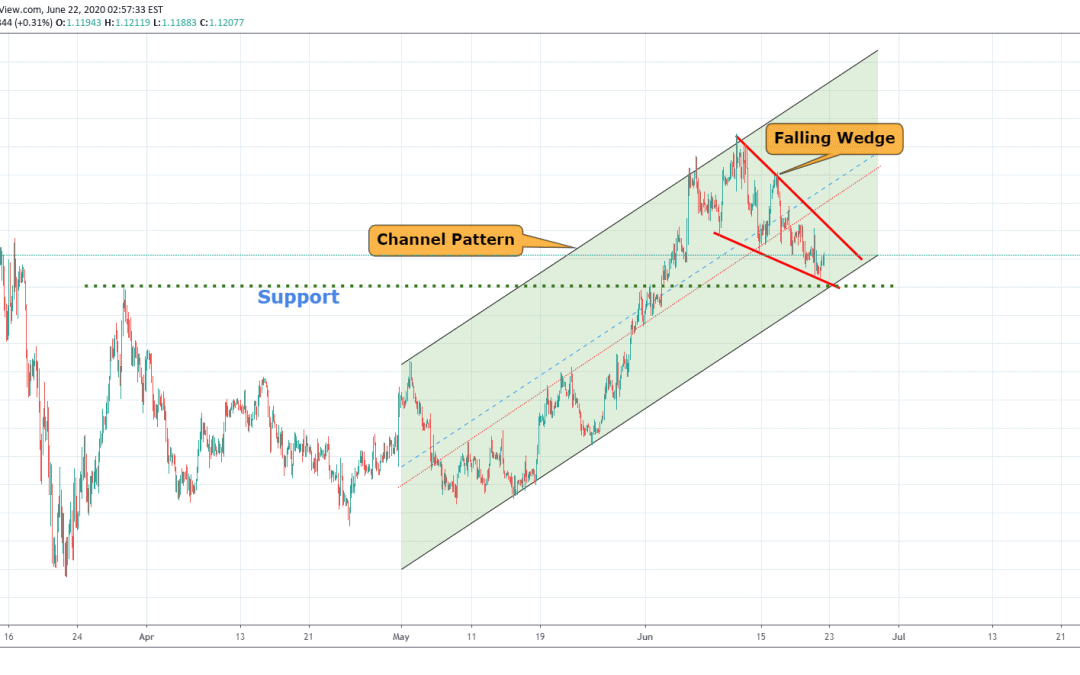
by Vivek | Jun 22, 2020 | EURUSD, Forex Trade Ideas
EURUSD has given a big upside movement, in channel pattern. From the resistance level of channel pattern, it has retraced toward the support level of channel pattern, by consolidating in a falling wedge pattern. As per chart pattern analysis, we might see upside...
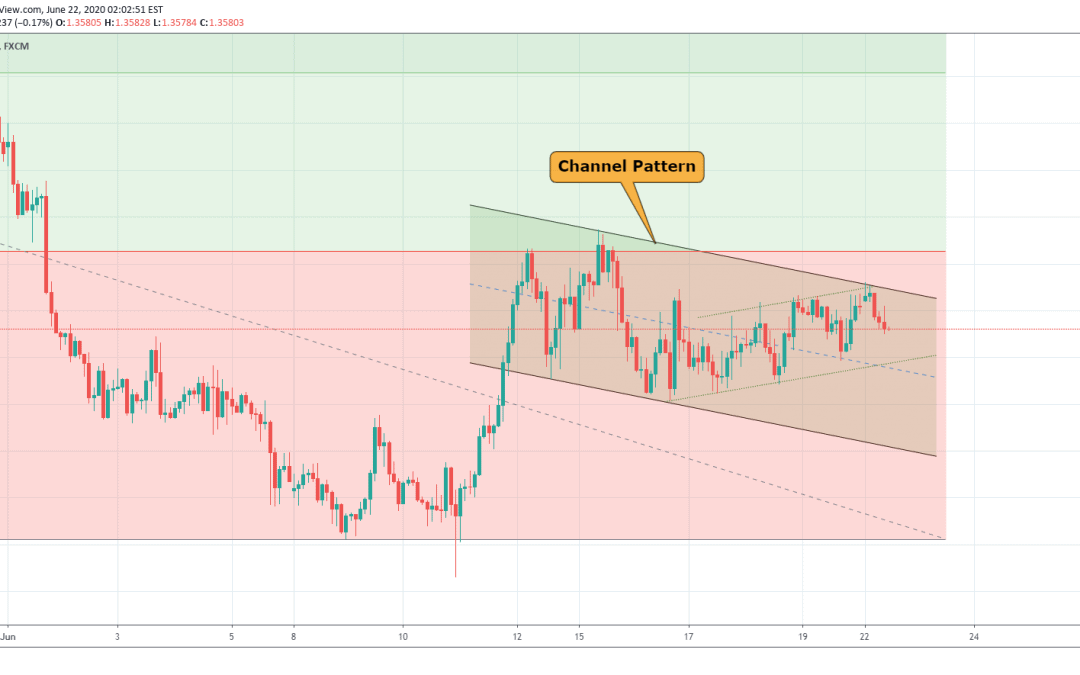
by Vivek | Jun 22, 2020 | Forex Trade Ideas, USDCAD
USDCAD has well supported the resistance & support level of the Fibonacci Retracement level, as shown in the chart. At the current level, it is trading near the Fibonacci resistance level & also it is trading in channel pattern. According to chart pattern...
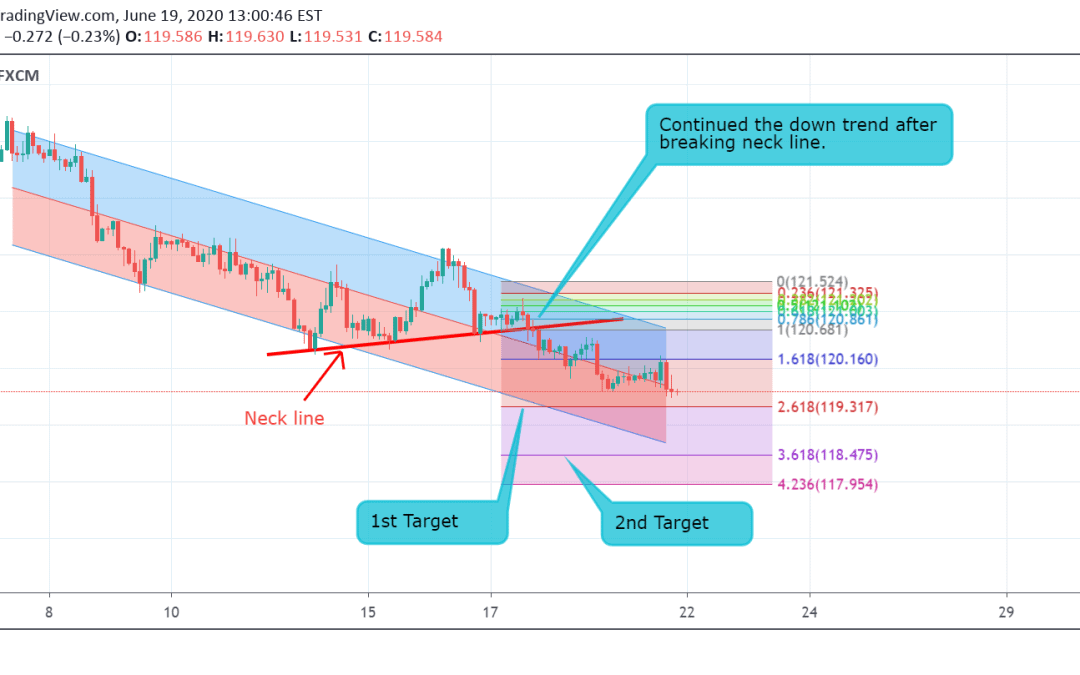
by Rishikesh Lilawat | Jun 19, 2020 | EURJPY, Forex Trade Ideas
Currently, EUR/JPY is trading at 119.58. The pair started a new down trend on 8th June and after giving the exit signal on regression trend by breaking the support level , it consolidated between the resistance and support levels. After breaking the support level and...
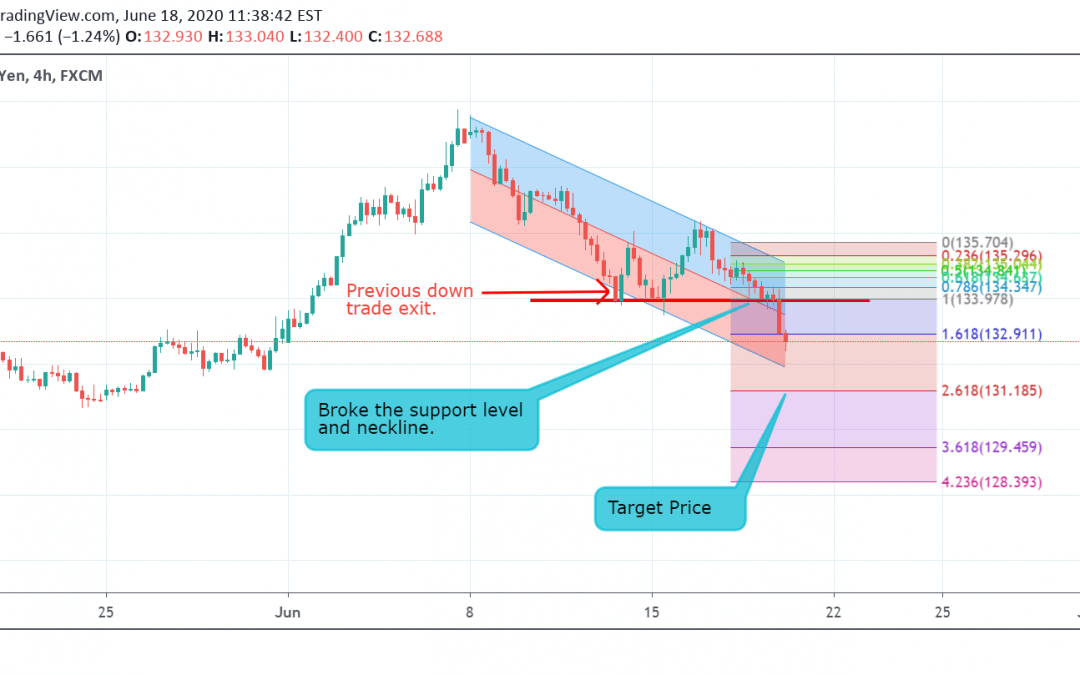
by Rishikesh Lilawat | Jun 18, 2020 | Forex Trade Ideas, GBPJPY
Currently, GBP/JPY is trading at 132.68. The pair started a new down trend on 9th June and after giving the exit signal on regression trend, it consolidated between the resistance and support levels. After breaking the support level and neck line at 133.97, the pair...
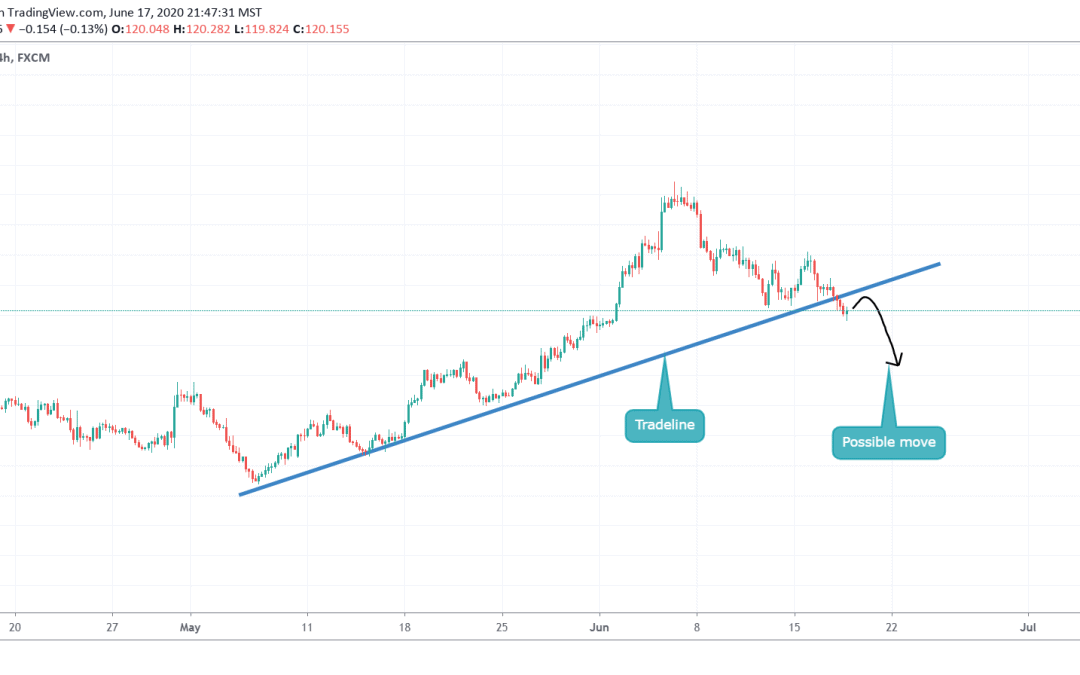
by Ryan Lopes | Jun 17, 2020 | EURJPY, Forex Trade Ideas
Hello, my fellow traders, hope you all are making some profits. We are here with our new analysis so that we can increase those profits for you. Let’s get into the analysis. As we can see, the price broke its trendline . So we can see a retest and then a downside...

 Why Scalpers Love 4XVision: A Deep Dive …January 18, 2026Scalping is one of the most demanding styles of Forex […]
 Using 4XVision in Volatile Markets: How …January 18, 2026Volatility is the heartbeat of the Forex market — […]
 Behind the Dashboard: How 4XVision Build…January 18, 2026In today’s fast-moving Forex landscape, […]
 4XVision: Trading Smarter with Cutting-E…October 29, 2025In Forex trading, every second matters. That’s why […]
 Behind the Screens: The Tech That Powers…October 29, 2025Trading moves fast. Decisions happen in seconds, and […]
 Top 5 Forex Trading Strategies That Actu…August 13, 2025Trade smarter. Stay ahead. Win consistently. Forex […]
 Unlocking Profitable Insights with 4XVis…February 21, 2025In today’s fast-paced Forex market, having access to […]
 BVQ Matrix: Transforming Forex Trading S…February 21, 2025Master the Forex Market with the Power of the BVQ Matrix – Precision, Profit, and Performance. […]