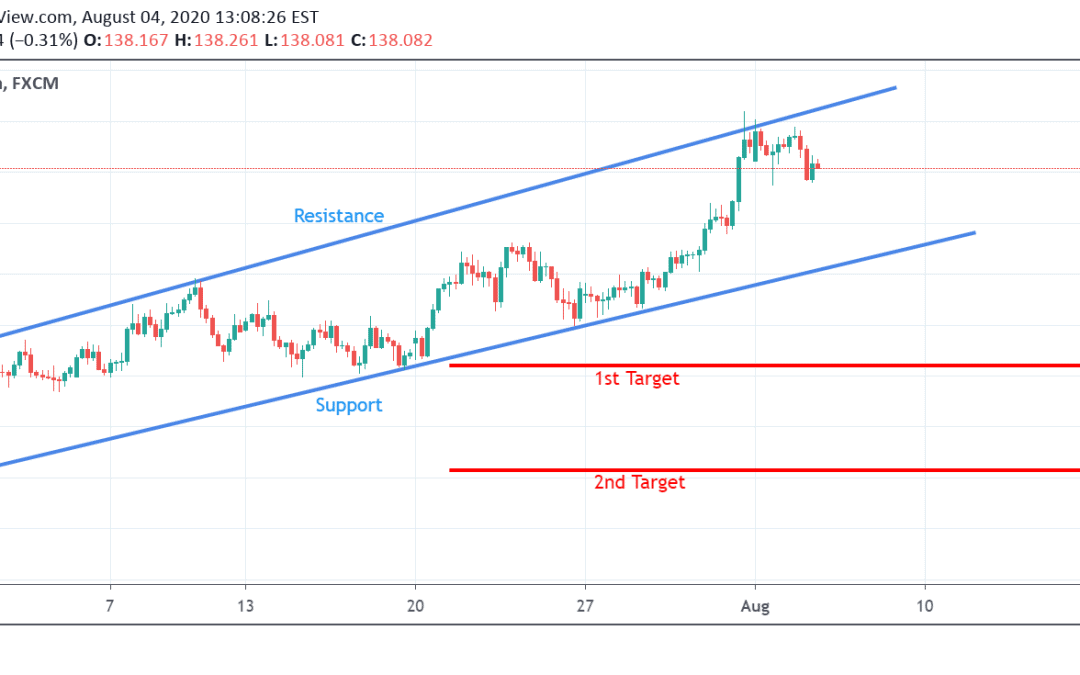
by Rishikesh Lilawat | Aug 4, 2020 | Forex Trade Ideas, GBPJPY
Currently, GBP/JPY is trading at 138.08. The pair may start a new down trend if it breaks the support level at 136.45. Previously, the pair was making higher high lower low pattern in the resistance and support wedges . If the pair starts a new down trend after...
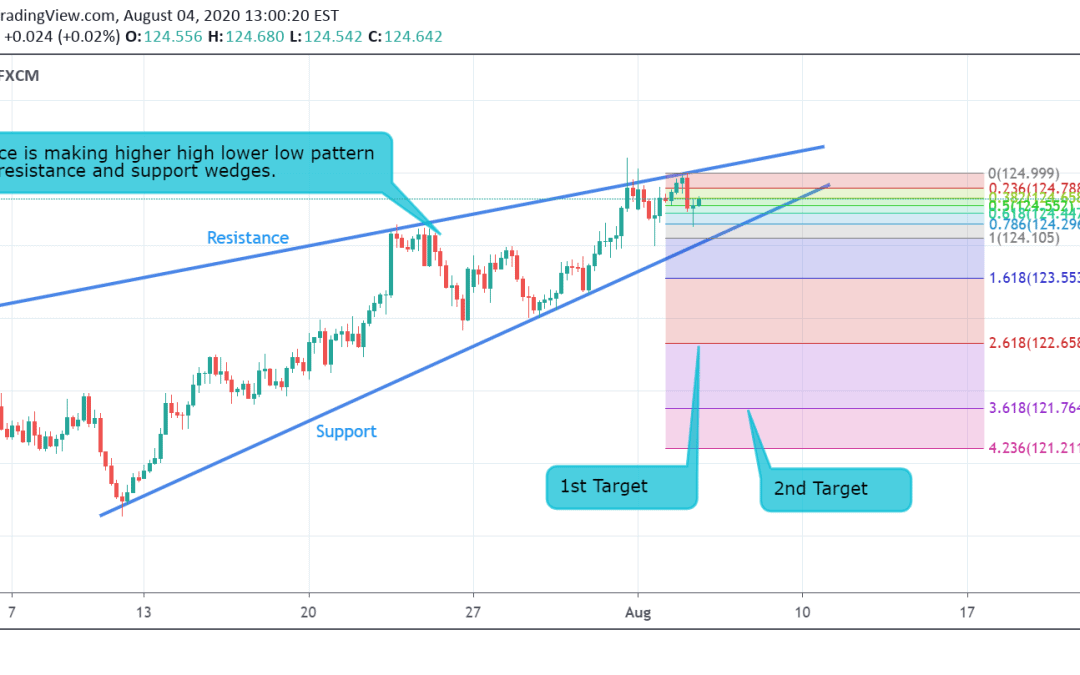
by Rishikesh Lilawat | Aug 4, 2020 | EURJPY, Forex Trade Ideas
Currently, EUR/JPY is trading at 124.66. The pair may start a new down trend if it breaks the support level at 124.10. Previously, the pair was making higher high lower low pattern in the resistance and support wedges . If the pair starts a new down trend after...
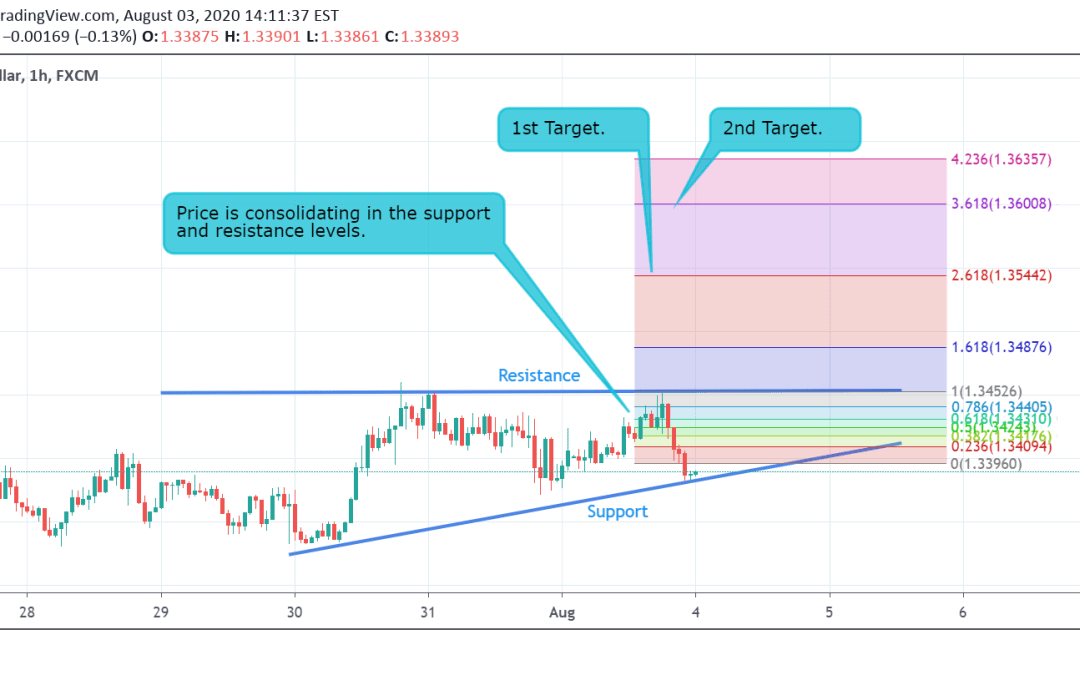
by Rishikesh Lilawat | Aug 3, 2020 | Forex Trade Ideas, USDCAD
Currently, USD/CAD is trading at 1.3388. The pair is consolidating in the ascending triangle pattern. Previously, the pair was trading in a down trend. There is a great possibility that the pair will rebound back from its resistance level . But if the price breaks...
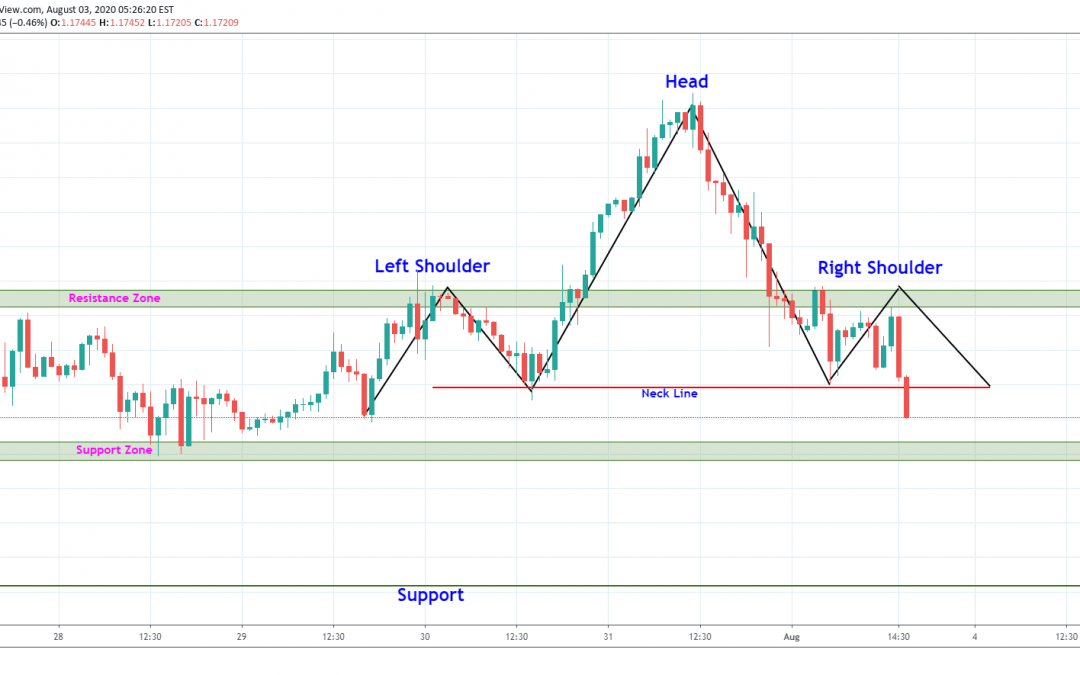
by Vivek | Aug 3, 2020 | EURUSD, Forex Trade Ideas
EURUSD has Formed the head and shoulder pattern at top, which indicate the trend reversal or possible short downside in EURUSD . According to chart pattern analysis , We might see downside . One can initiate short side trade with proper risk management and stop loss....
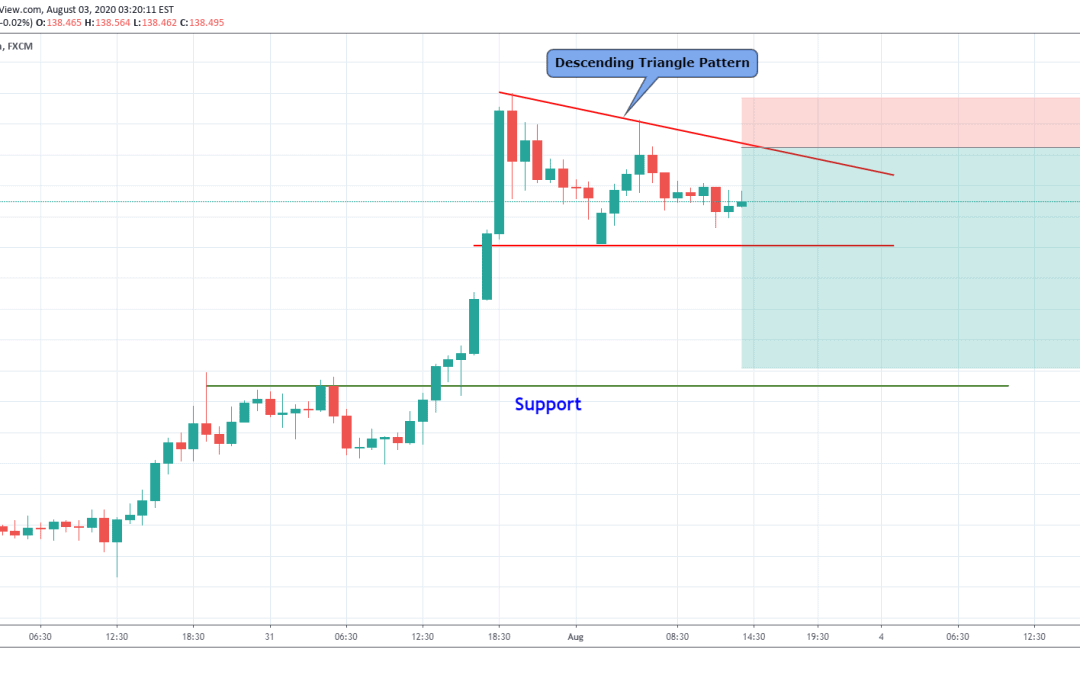
by Vivek | Aug 3, 2020 | Forex Trade Ideas, GBPJPY
GBPJPY is Forming the bearish pattern at the top after giving a good upside movement. Descending the Triangle pattern indicates that we might see a downside in GBPJPY towards the support level , as shown in the chart. According to chart pattern analysis, one can...
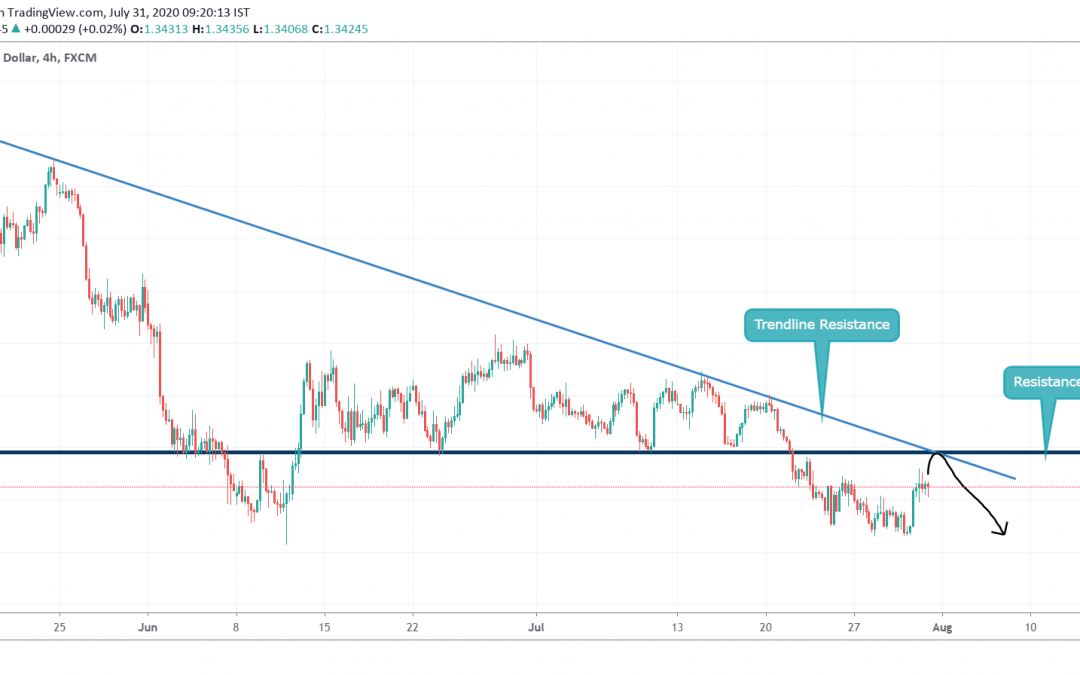
by Ryan Lopes | Jul 30, 2020 | Forex Trade Ideas, USDCAD
Hello, my fellow traders, hope you all are making some profits. We are here with our new analysis so that we can increase those profits for you. Let’s get into the analysis. As we can see, the price is in downtrend. It will go up a bit, till the Resistance, for retest...

 Why Scalpers Love 4XVision: A Deep Dive …January 18, 2026Scalping is one of the most demanding styles of Forex […]
 Using 4XVision in Volatile Markets: How …January 18, 2026Volatility is the heartbeat of the Forex market — […]
 Behind the Dashboard: How 4XVision Build…January 18, 2026In today’s fast-moving Forex landscape, […]
 4XVision: Trading Smarter with Cutting-E…October 29, 2025In Forex trading, every second matters. That’s why […]
 Behind the Screens: The Tech That Powers…October 29, 2025Trading moves fast. Decisions happen in seconds, and […]
 Top 5 Forex Trading Strategies That Actu…August 13, 2025Trade smarter. Stay ahead. Win consistently. Forex […]
 Unlocking Profitable Insights with 4XVis…February 21, 2025In today’s fast-paced Forex market, having access to […]
 BVQ Matrix: Transforming Forex Trading S…February 21, 2025Master the Forex Market with the Power of the BVQ Matrix – Precision, Profit, and Performance. […]