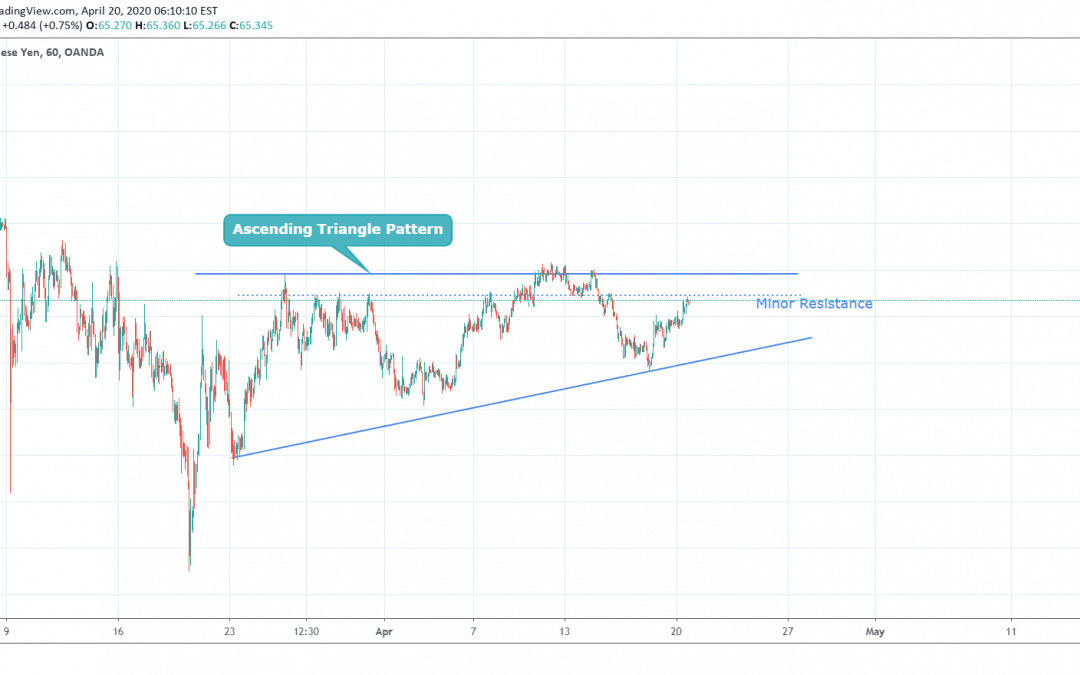
by Vivek | Apr 20, 2020 | Forex Trade Ideas, NZDJPY
NZDJPY is Trading in Ascending Triangle pattern, also it at a very insignificant resistance level from this level, we might see some price move on the downside towards the trendline for ascending triangle pattern. One can initiate the trade, on the short side at the...
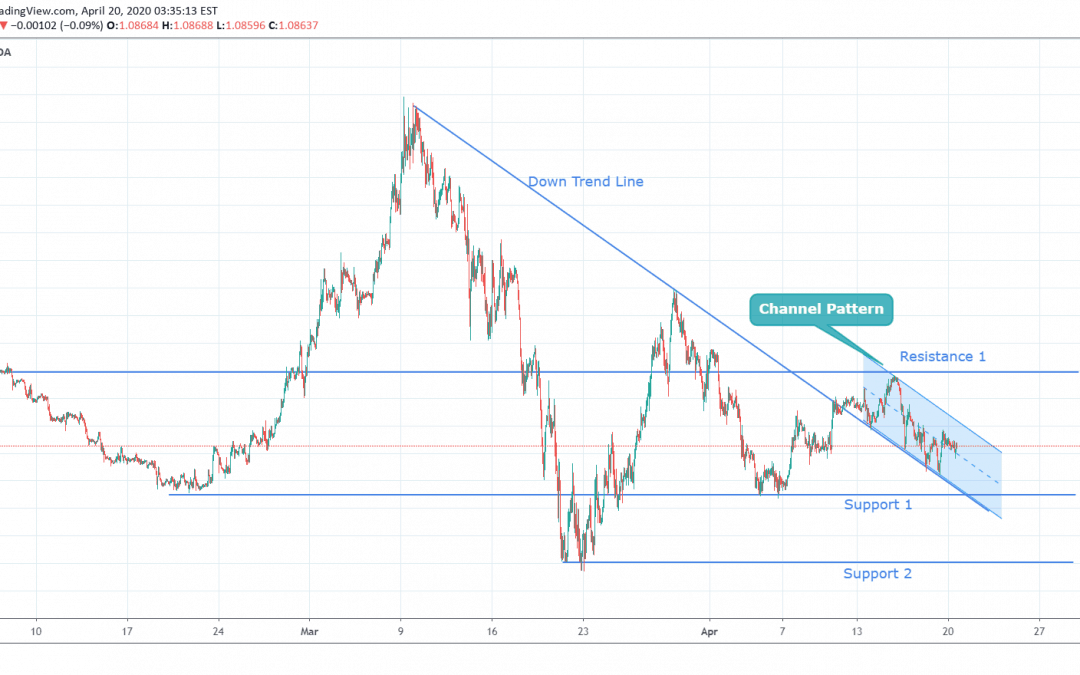
by Vivek | Apr 20, 2020 | EURUSD, Forex Trade Ideas
EURUSD has given a breakout from its downtrend line, but EURUSD price is still trading near that downtrend line in channel pattern, so the breakout is not so strong to change long term trends. Considering this, we might see a downside in EURUSD towards the support1,...
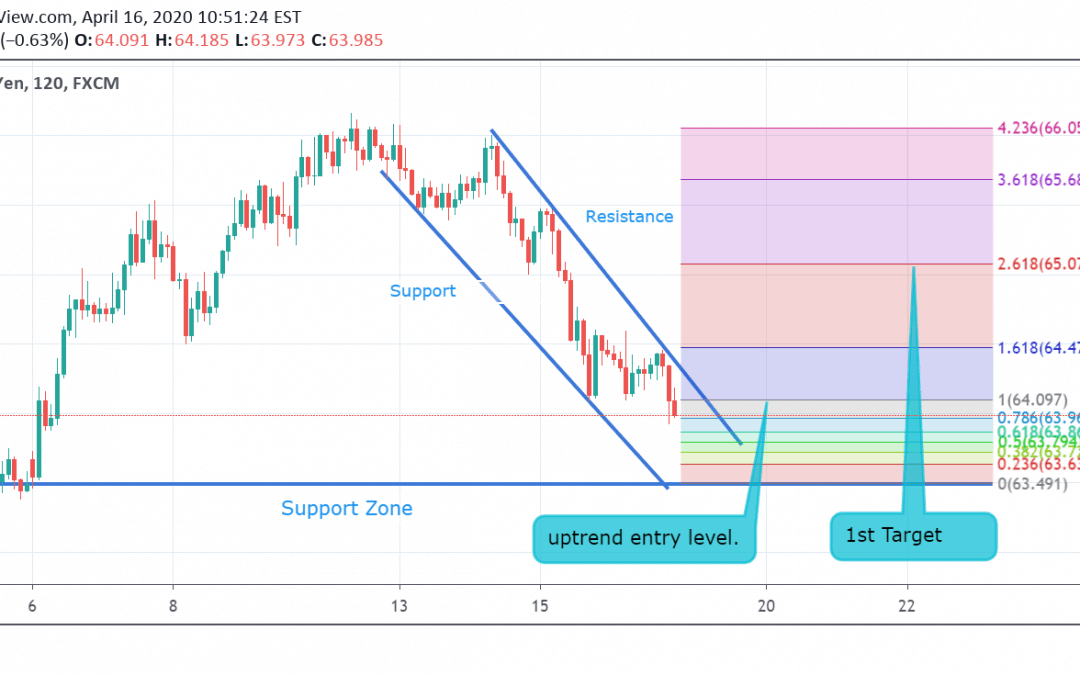
by Rishikesh Lilawat | Apr 16, 2020 | Forex Trade Ideas, NZDJPY
Currently, NZD/JPY is trading at 64.03. The pair started a downtrend on 14 April and it’s about to touch its support zone . It is possible that after touching its support zone the price may rebound back from there. If the price breaks 64.09 level after...
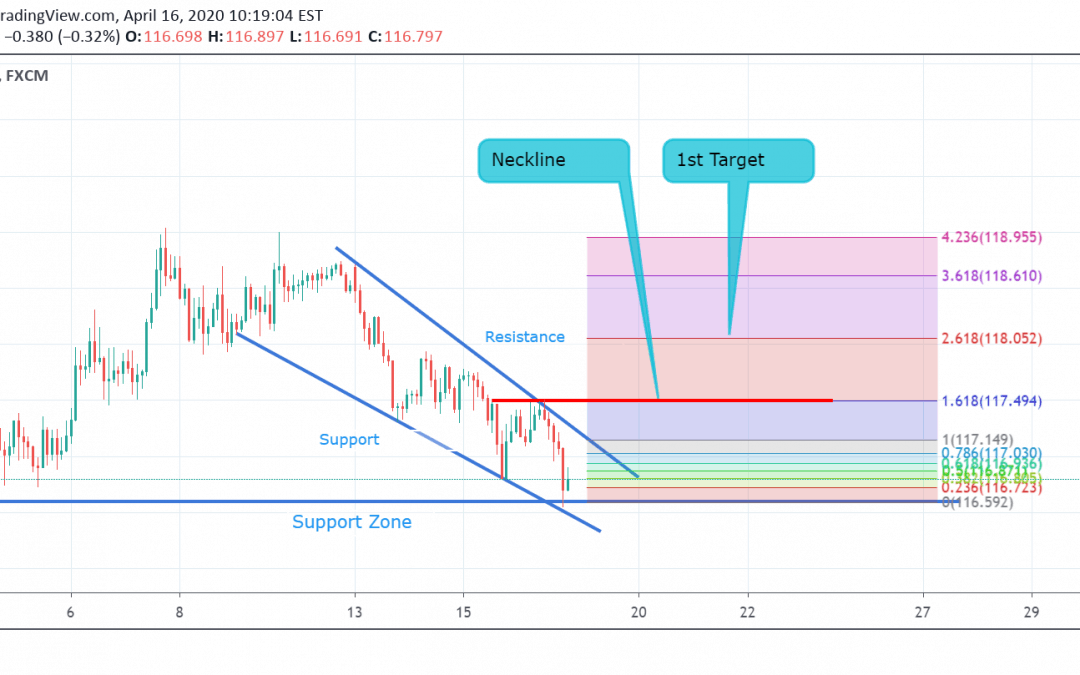
by Rishikesh Lilawat | Apr 16, 2020 | EURJPY, Forex Trade Ideas
Currently, EUR/JPY is trading at 116.88. The pair started a downtrend on 13 April and after touching its support zone , it is possible that it will rebound from here. If the price breaks neckline at 117.49, it may enter into a new uptrend and then its next resistance...
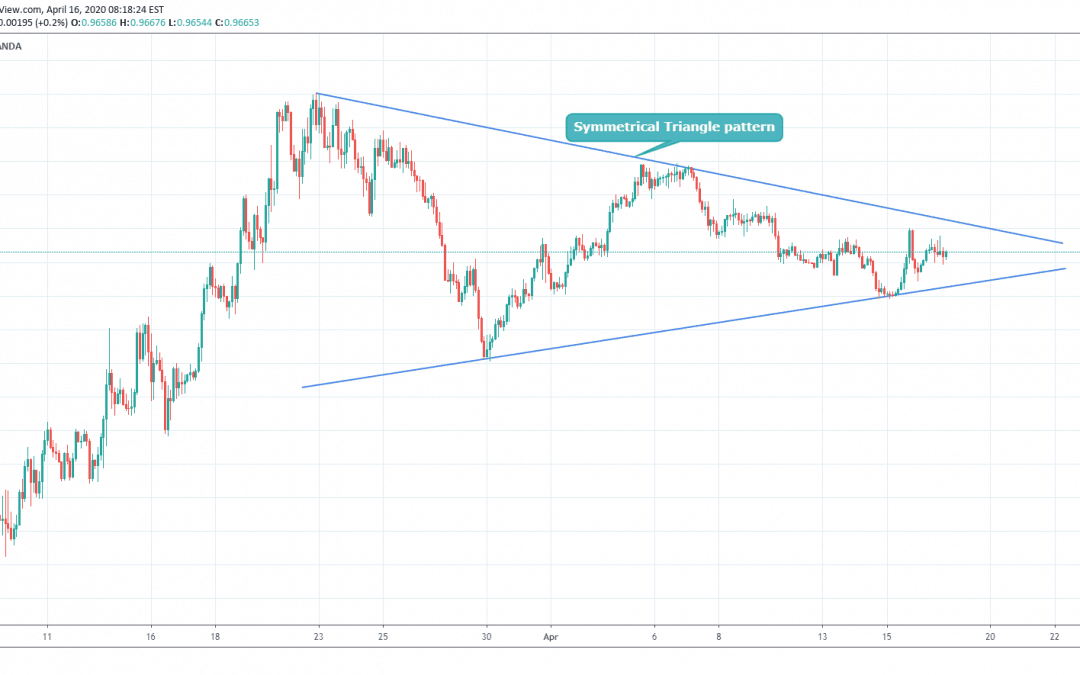
by Vivek | Apr 16, 2020 | Forex Trade Ideas, USDCHF
USDCHF is trading in symmetrical triangle pattern as it is indecisiveness in price action . once the USDCHF breakout of this pattern we can trade on breakout side for long term trend. it is at very near point of breakout from pattern. If You Like Idea Do...

by Vivek | Apr 16, 2020 | Forex Trade Ideas, USDCAD
USDCAD was trading in falling wedge pattern for a very long time now it has broke-out from that pattern on the upside, so might see a new trend in USDCAD . We can see consolidation or small price correction for a shorter time and then a new long trend. One can...

 Why Scalpers Love 4XVision: A Deep Dive …January 18, 2026Scalping is one of the most demanding styles of Forex […]
 Using 4XVision in Volatile Markets: How …January 18, 2026Volatility is the heartbeat of the Forex market — […]
 Behind the Dashboard: How 4XVision Build…January 18, 2026In today’s fast-moving Forex landscape, […]
 4XVision: Trading Smarter with Cutting-E…October 29, 2025In Forex trading, every second matters. That’s why […]
 Behind the Screens: The Tech That Powers…October 29, 2025Trading moves fast. Decisions happen in seconds, and […]
 Top 5 Forex Trading Strategies That Actu…August 13, 2025Trade smarter. Stay ahead. Win consistently. Forex […]
 Unlocking Profitable Insights with 4XVis…February 21, 2025In today’s fast-paced Forex market, having access to […]
 BVQ Matrix: Transforming Forex Trading S…February 21, 2025Master the Forex Market with the Power of the BVQ Matrix – Precision, Profit, and Performance. […]