by Vivek | Sep 4, 2020 | Forex Trade Ideas, USDJPY
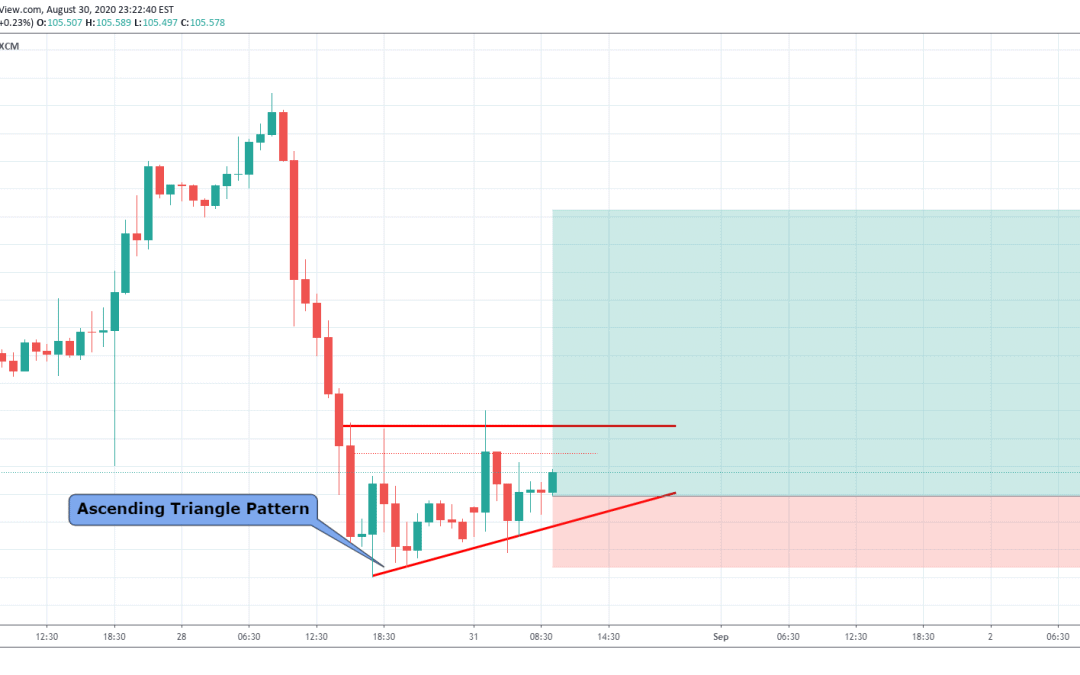
USDJPY is at support level and also it has forming and ascending triangle pattern at support which indicate we might see upside in USDJPY . According to chart pattern analysis, One can initiate long side trade with risk management system and stop loss. Thank You Read...
by Vivek | Aug 24, 2020 | Forex Trade Ideas, GBPUSD
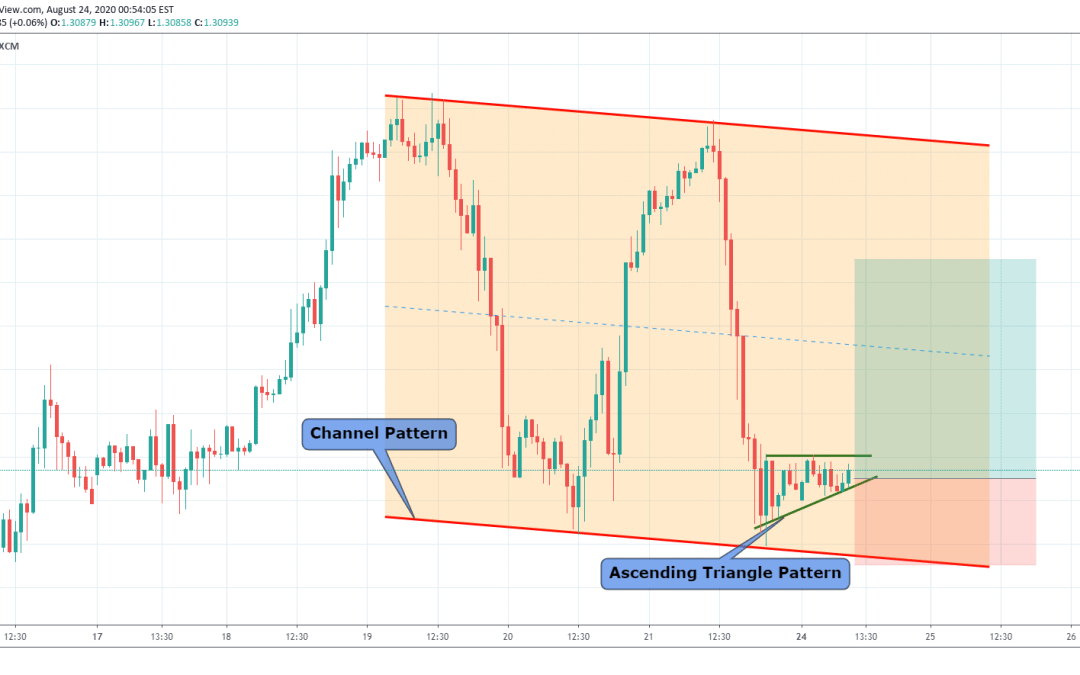
GBPUSD is trading in Channel Pattern and also it is trading at the support level of channel pattern. it has formed ascending triangle pattern at bottom or at support level of channel pattern . According to chart pattern analysis, we might see upside in GBPUSD from...
by Vivek | Aug 20, 2020 | Forex Trade Ideas, NZDJPY
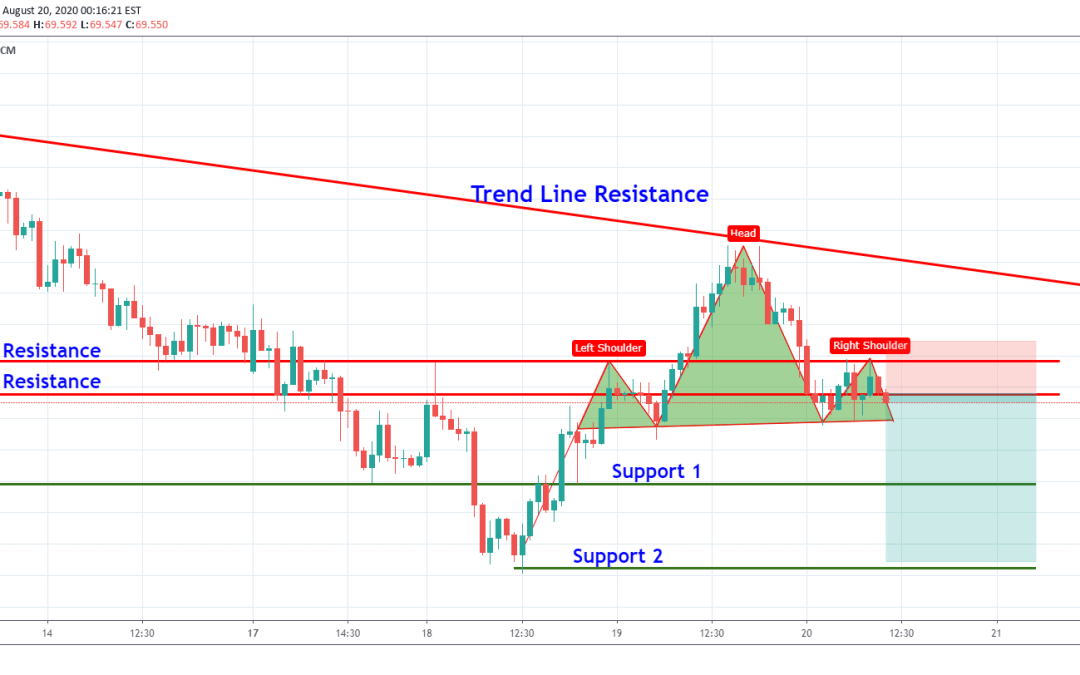
NZDJPY has formed head and shoulder pattern after touching to its trend line resistance level as shown in chart. According to chart pattern analysis we might see downside in NZDJPY towards support level . One can initiate short side trade with Risk management system...
by Vivek | Aug 20, 2020 | Forex Trade Ideas, USDCHF
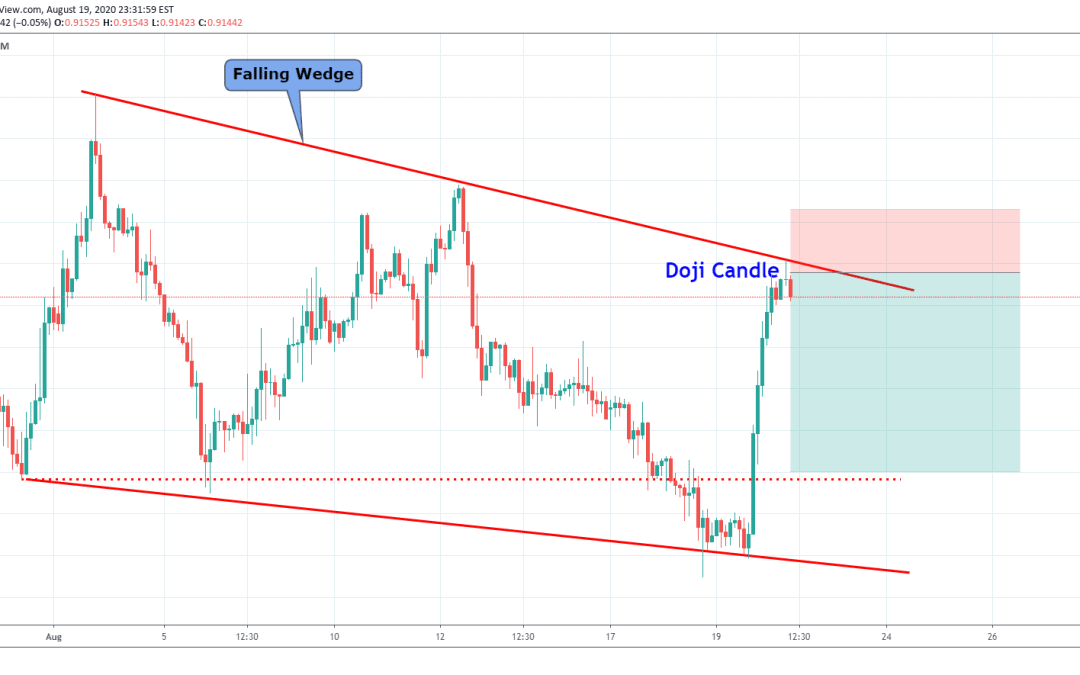
USDCHF is trading in falling wedge pattern. It is trading at resistance level of falling wedge after giving good up side from previous day . We might see some retracement in USDCHF .According to chart pattern analysis we think, one can initiate a short side trade with...
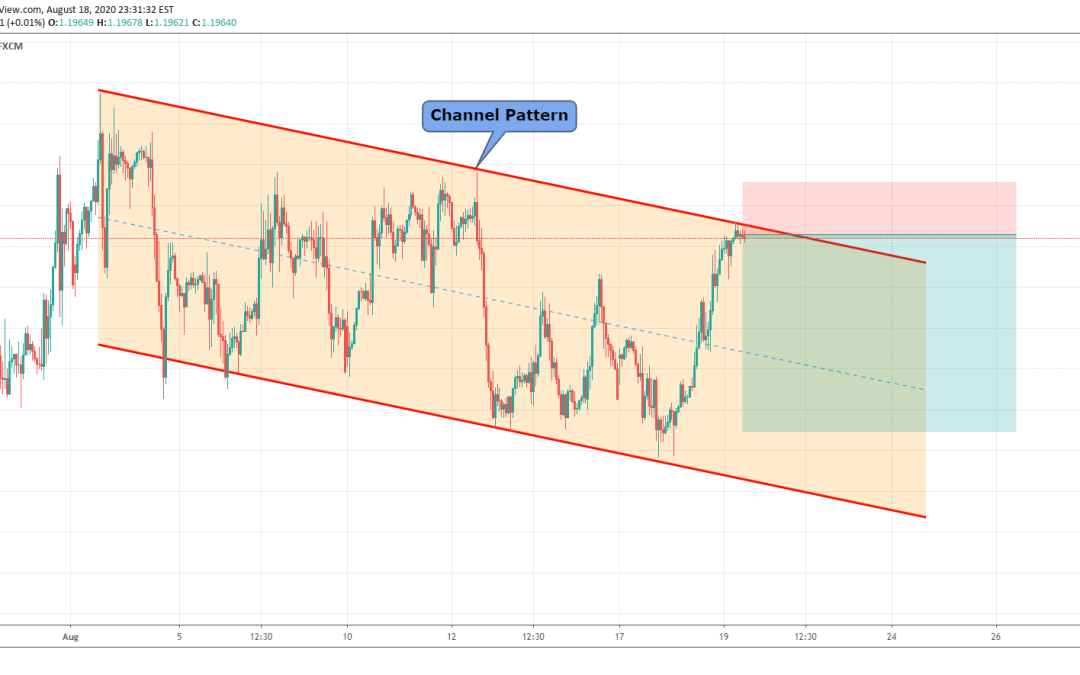
by Vivek | Aug 20, 2020 | Forex Trade Ideas, GBPCHF
GBPCHF is consolidating on downside and also it is trading at resistance level of channel pattern. According to chart pattern analysis, We might see down side in GBPCHF . One can initiate short side trade with proper risk management system and stop loss Thank You....


