by Rishikesh Lilawat | Mar 24, 2020 | Forex Trade Ideas, USDJPY
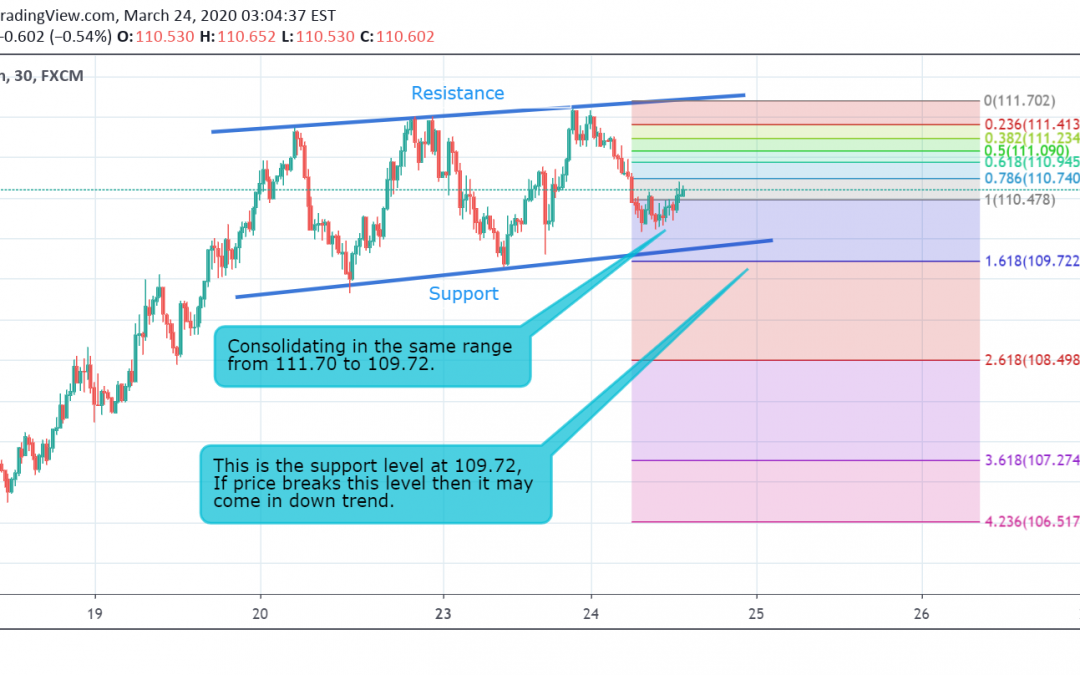
Currently the price is trading at 110.50 and hovering in the same range of 111.70 to 109.72. As the price is moving towards resistance level , if it reverses back from there and breaches the level of support at 109.72. Then it may come in down trend and then its next...
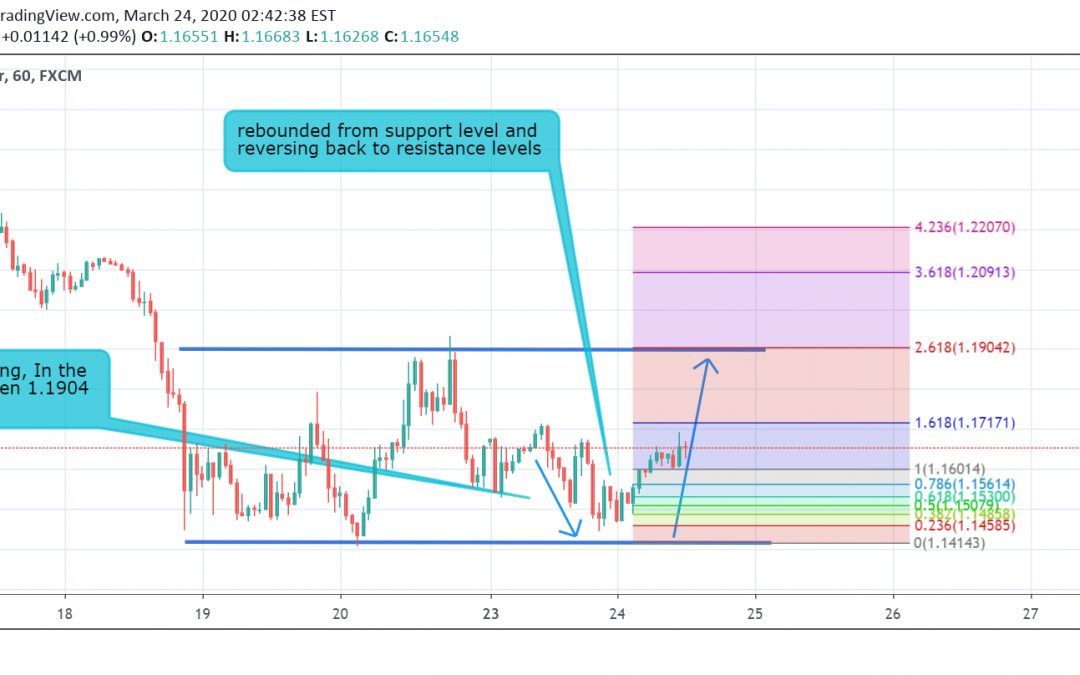
by Rishikesh Lilawat | Mar 24, 2020 | Forex Trade Ideas, GBPUSD
As the price is trading at its all time low and started consolidating in the same range from 1.1904 to 1.1414. There is no strong signal of trend reversal as the price is hovering in the same range, It is not forming any particular pattern. If the price breaches...
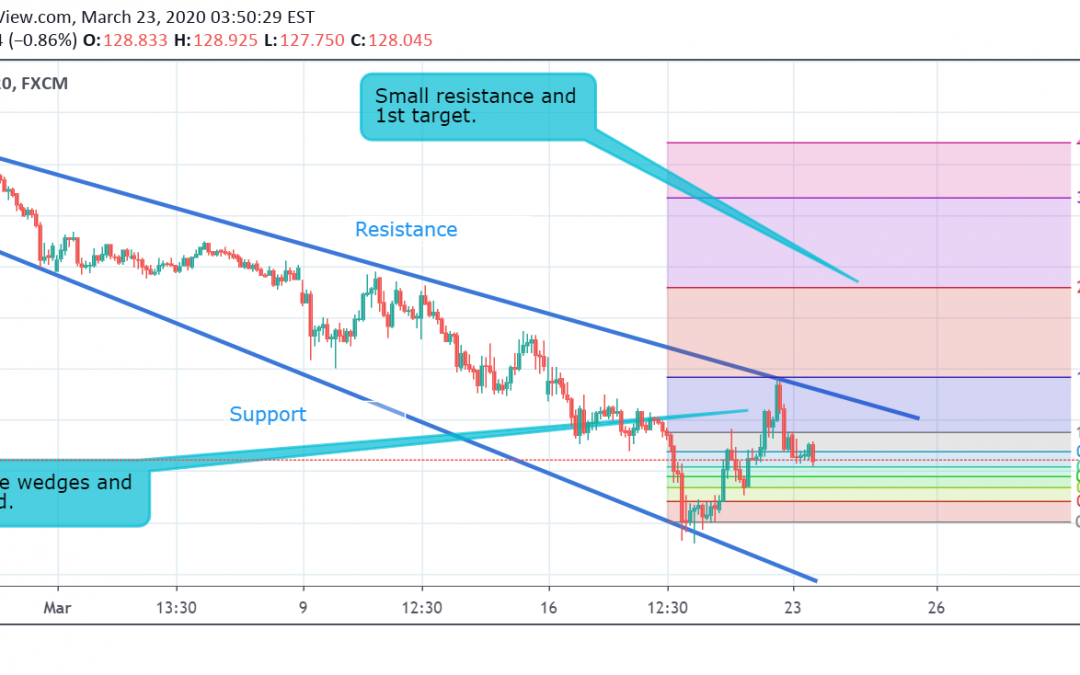
by Rishikesh Lilawat | Mar 23, 2020 | Forex Trade Ideas
Currently price is trading at 128.11 while writing, following the down trend and hovering in the wedges . It seems chances of reversal but no conformed signals can be seen. If the price breaks the resistance level of 132.11, then it may come in up trend and then its...
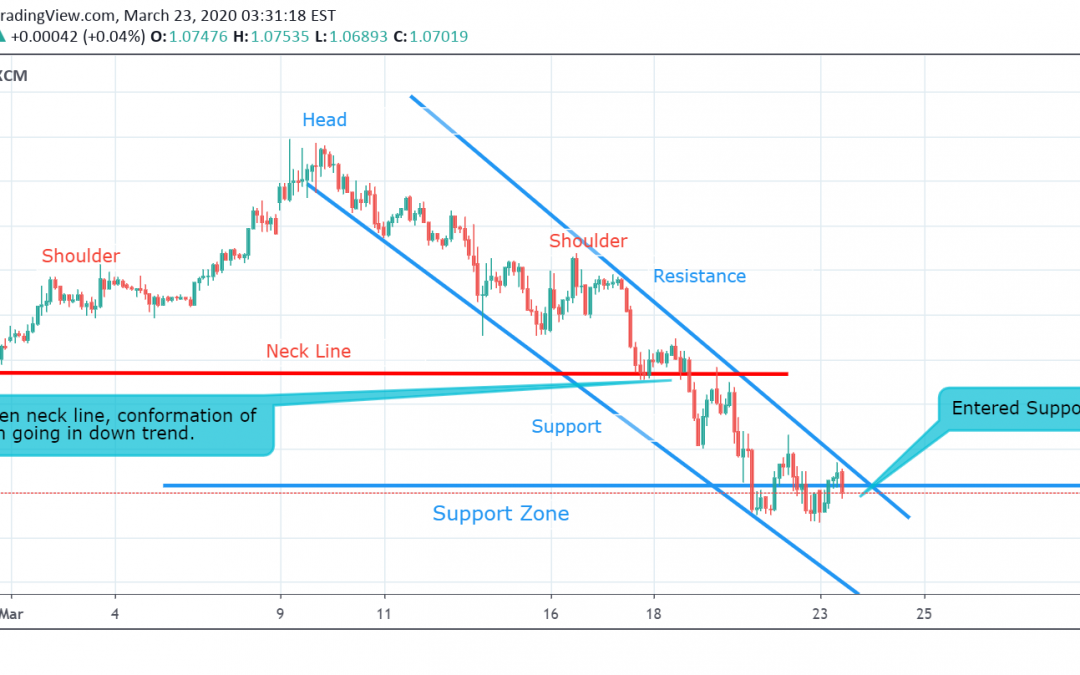
by Rishikesh Lilawat | Mar 23, 2020 | EURUSD, Forex Trade Ideas
Currently the price is trading at its three years low and entered the support zone , After forming head and shoulder pattern it broke the neck line to again go in down trend. As the price has already touched the support zone it is possible that it can reverse back...
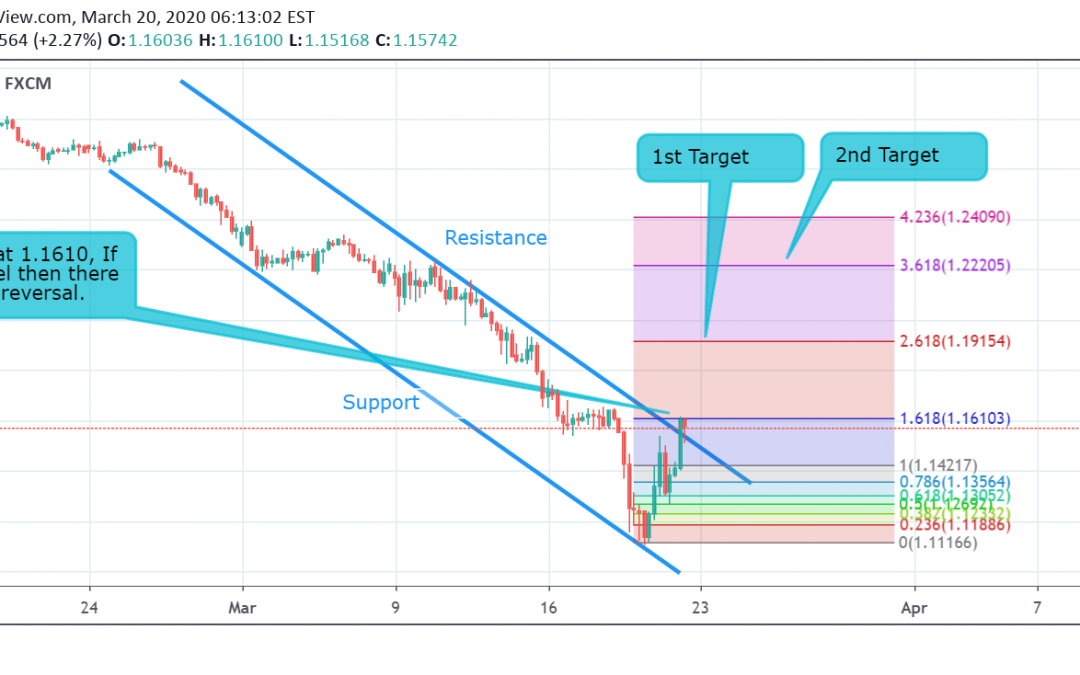
by Rishikesh Lilawat | Mar 20, 2020 | Forex Trade Ideas, GBPCHF
GBP/CHF currently trading at 1.1575 and the resistance level is at 1.1610, If the price breaches the resistance level then there are chances of trend reversal. Price on 19 march 2020 rebounded from its support level and continuously moved toward its resistance...


