by Rishikesh Lilawat | Apr 6, 2020 | Forex Trade Ideas, USDJPY
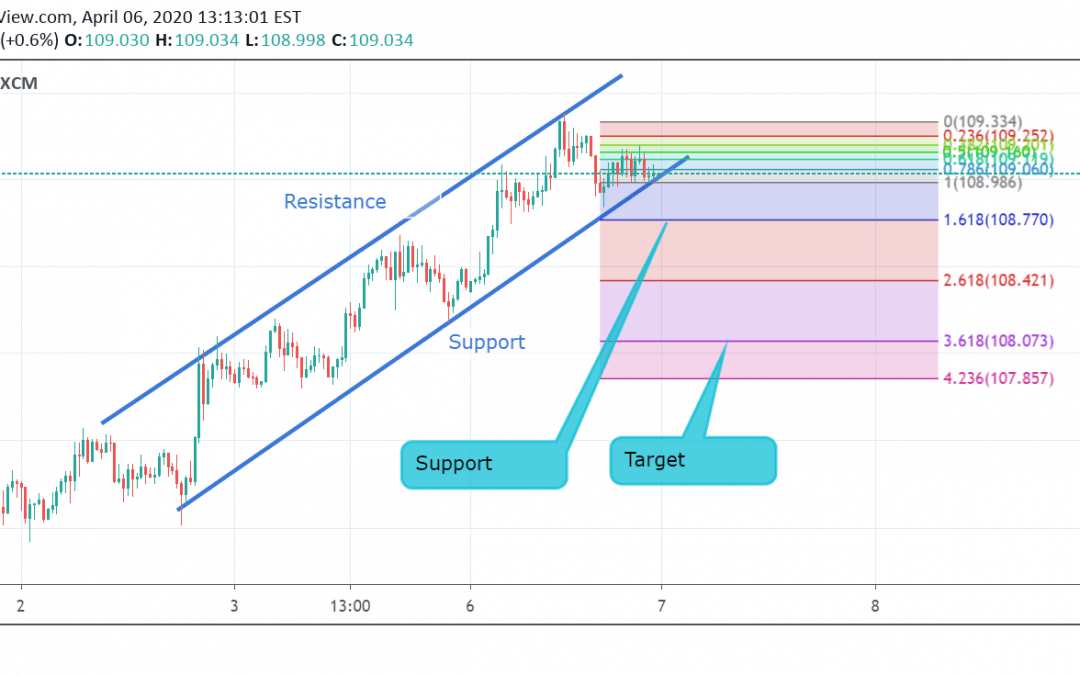
Currently, USD/JPY is trading at 109.01. Last week this pair started a new uptrend and now is moving towards its support level at 108.77. If it breaks the level of support at 108.77, it may enter into a downtrend and then the first target will be at 108.07. Do follow...
by Rishikesh Lilawat | Apr 6, 2020 | EURUSD, Forex Trade Ideas
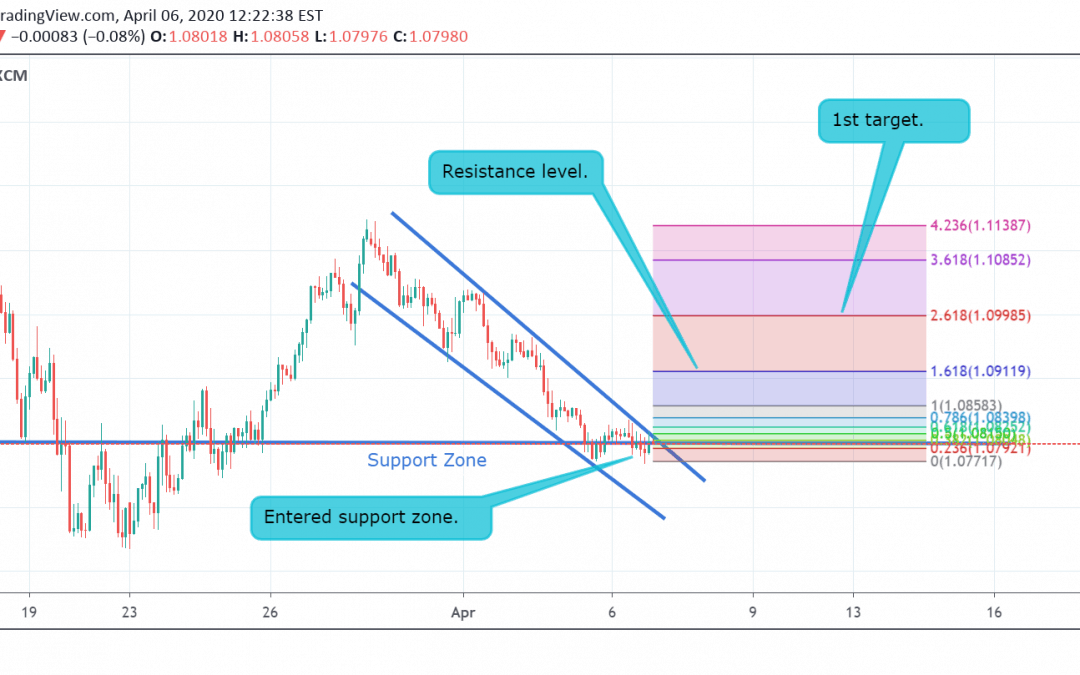
Currently, EUR/USD is trading at 1.0798. Last week after trading in downtrend, this pair is now trading in sideways trend. As the price has already touched support zone , there are chances of reversal. If it breaks the level of resistance at 1.0911 it may enter into...
by Rishikesh Lilawat | Apr 3, 2020 | Forex Trade Ideas, GBPCAD
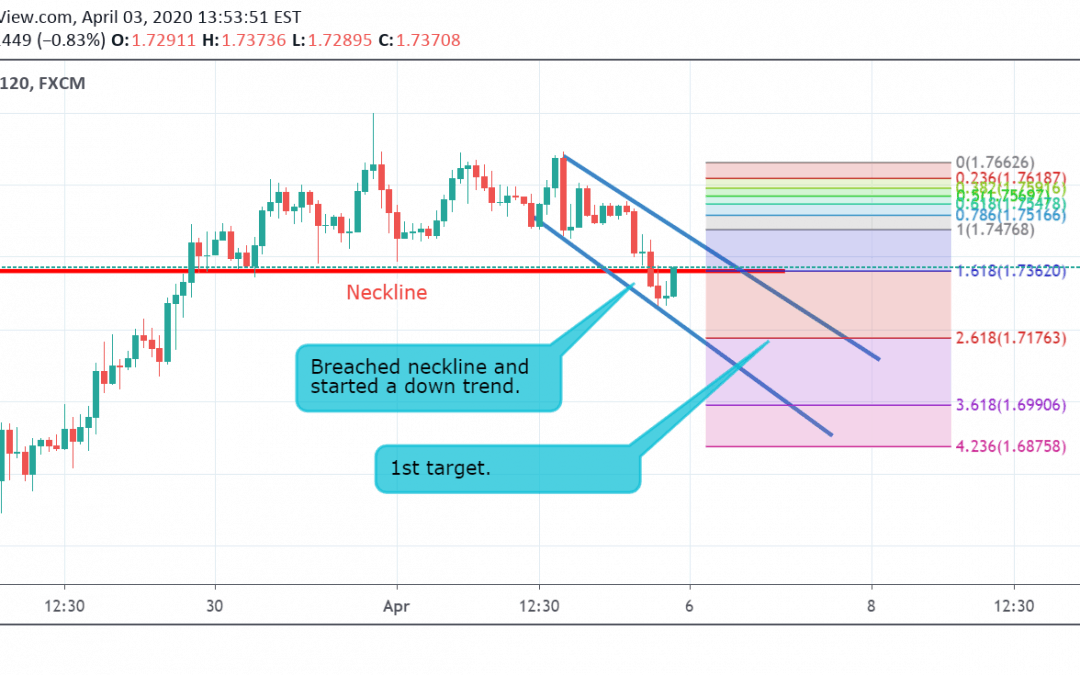
Currently, GBP/CAD is trading at 1.7346 which has already broken neckline at 1.7362. This week, GBP/CAD started trading in downtrend and now crossed its neckline at 1.7362. If it continues the same trend, the pair may hit the first target at 1.7176. Do follow us for...
by Rishikesh Lilawat | Apr 3, 2020 | EURCAD, Forex Trade Ideas
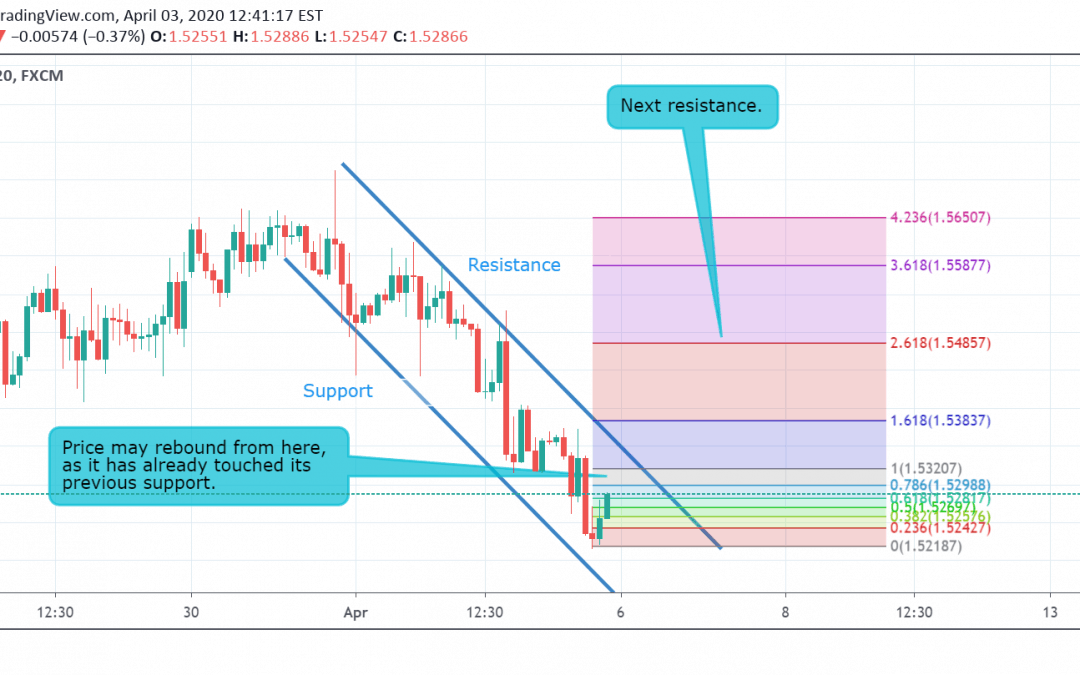
Currently, EUR/CAD is trading at 1.5283 moving towards its resistance level . This week EUR/CAD started trading in downtrend and now moving towards its resistance level at 1.5383. If it breaks resistance level at 1.5383, the pair may come into uptrend and then...
by Rishikesh Lilawat | Apr 2, 2020 | Forex Trade Ideas, NZDUSD
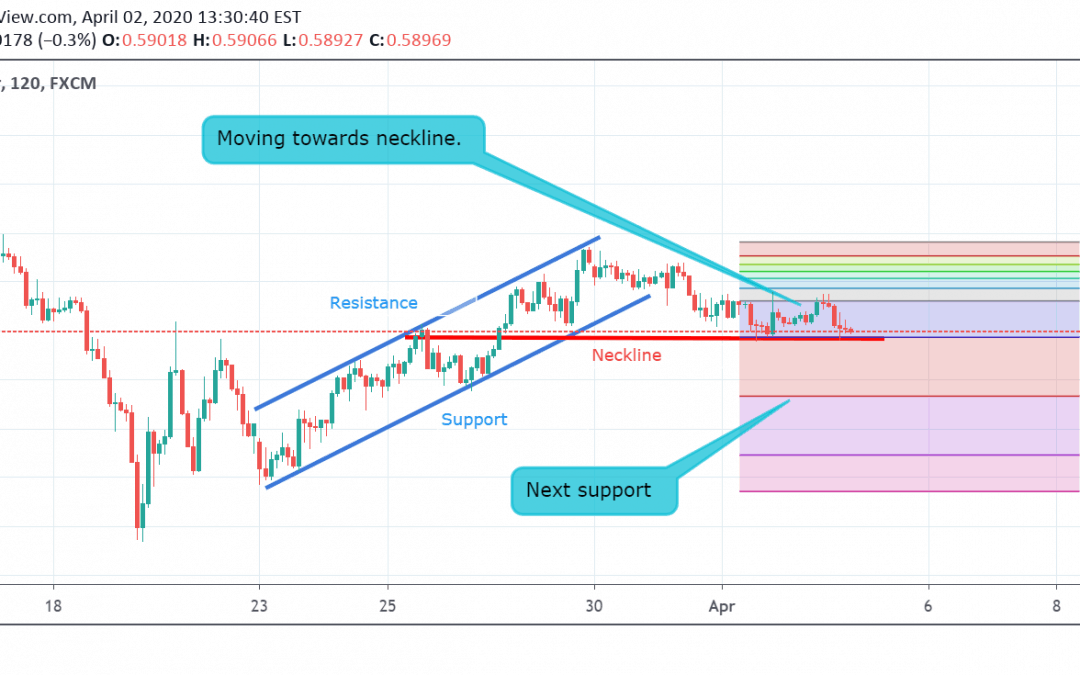
Currently, NZD/USD is trading at 0.5898 moving towards its neckline. On Monday, March 30 this pair started trading in a sideways trend and now moving towards its neckline at 0.5886. If it breaks neckline level at 0.5886, the pair may come into down trend, and then...


