by Rishikesh Lilawat | Apr 22, 2020 | Forex Trade Ideas, USDCHF
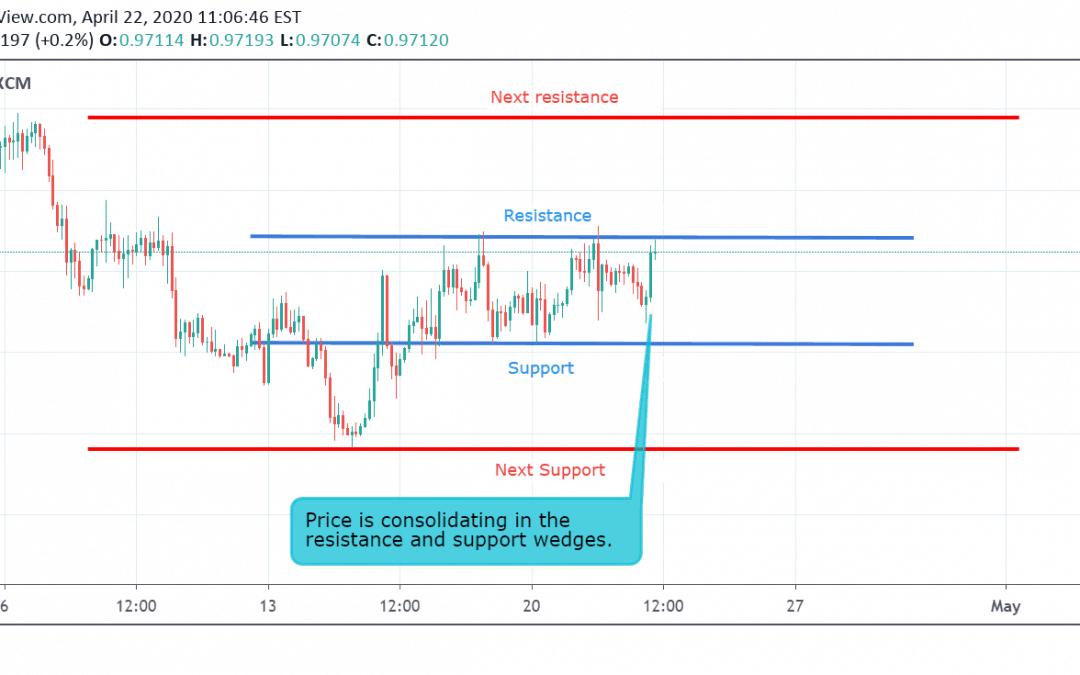
Currently, USD/CHF is trading at 0.9694. The pair started a sideways trend on 15 April and now consolidating in the resistance and support wedges . If the price breaks its support level at 0.9655, then it may touch its next support level at 0.9591. If the price breaks...
by Rishikesh Lilawat | Apr 22, 2020 | Forex Trade Ideas, USDJPY
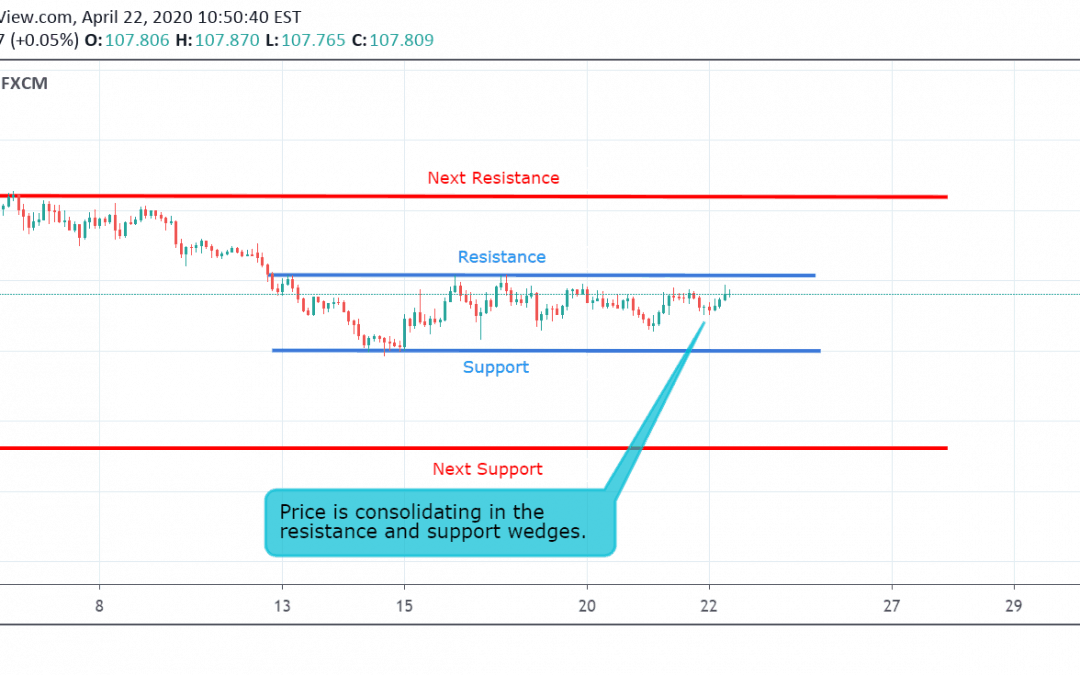
Currently, USD/JPY is trading at 107.86. The pair started a sideways trend on 15 April and now consolidating in the resistance and support wedges . If the price breaks its support level at 106.98, then it may touch its next support level at 105.61. If the price breaks...
by Rishikesh Lilawat | Apr 21, 2020 | Forex Trade Ideas, GBPAUD
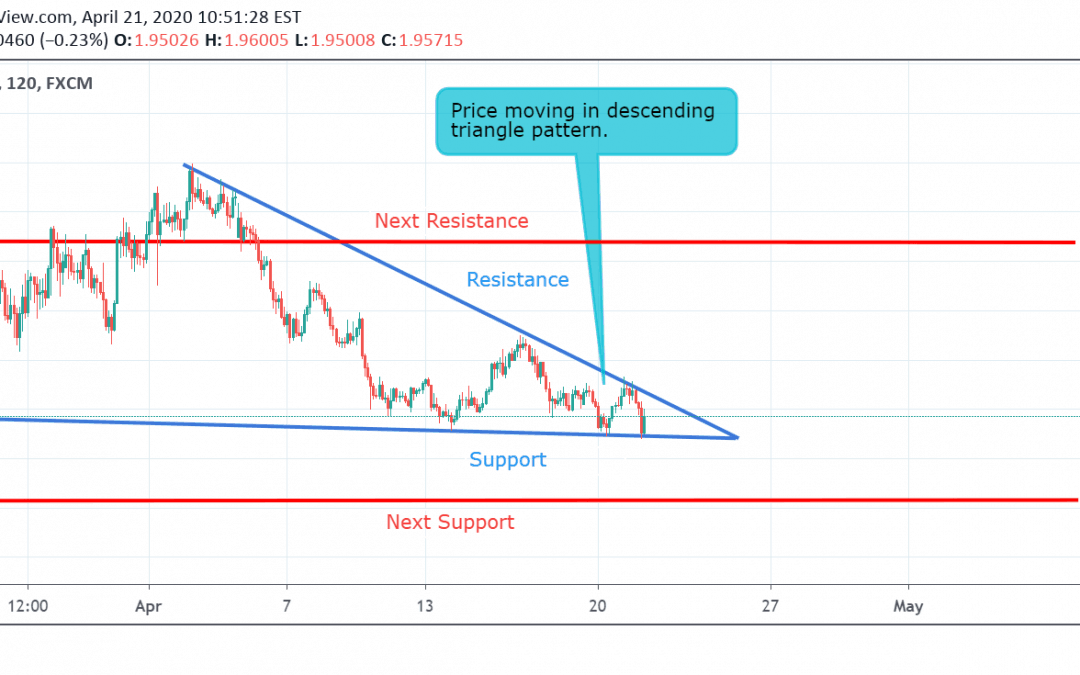
Currently, GBP/AUD is trading at 1.9584. The pair started a downtrend on 6 April and now consolidating in the descending triangle wedges . If the price breaks its support level at 1.9481, then it may touch its next support level at 1.9235. If the price breaks...
by Rishikesh Lilawat | Apr 20, 2020 | Forex Trade Ideas, USDCAD
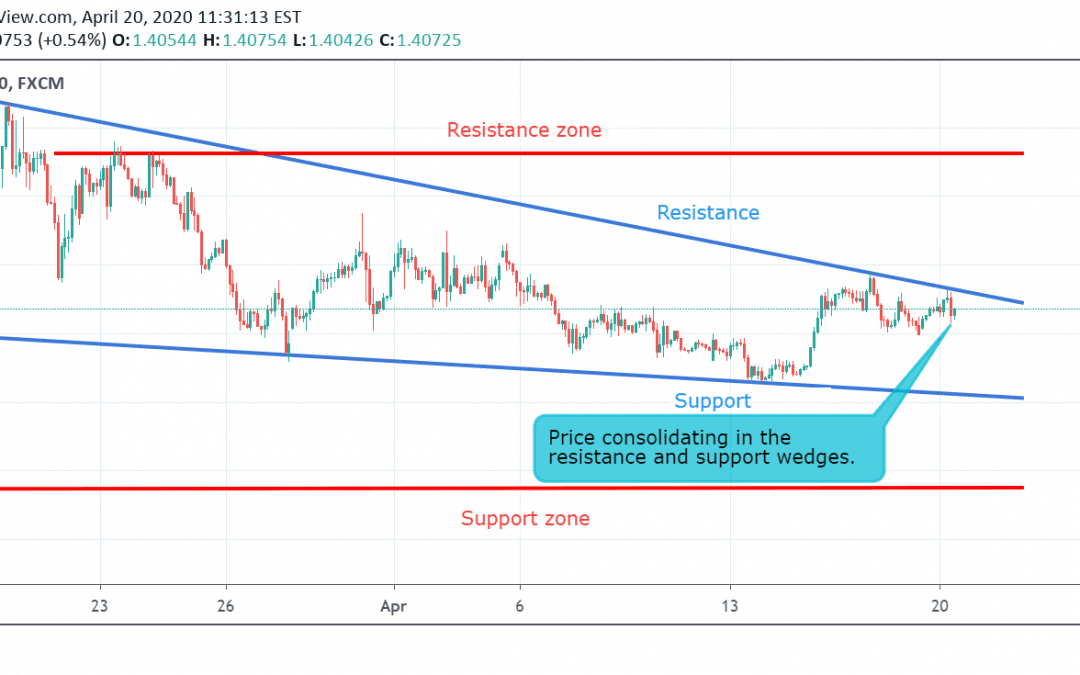
Currently, USD/CAD is trading at 1.4060. The pair started a sideways trend on 30 March and now consolidating in the support and resistance wedges . If the price breaks its support level at 1.3855, then it may touch its support zone at 1.3545. If the price breaks...
by Rishikesh Lilawat | Apr 20, 2020 | Forex Trade Ideas, GBPUSD
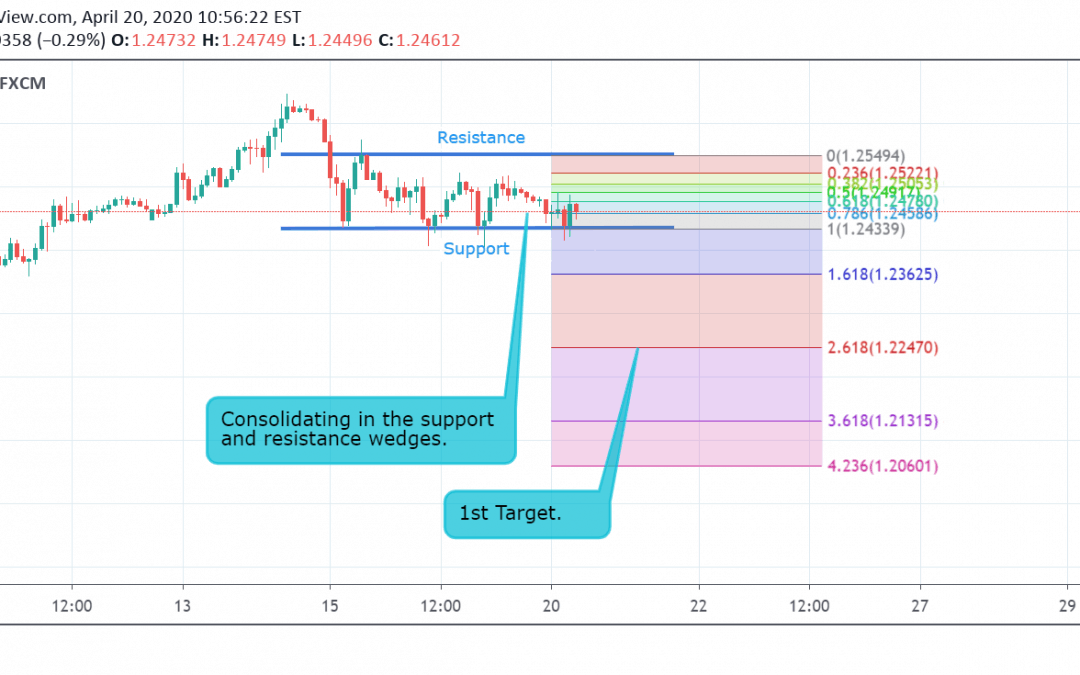
Currently, GBP/USD is trading at 1.2462. The pair started a sideways trend on 14 April and now consolidating in the support and resistance wedges . If the price breaks its support level at 1.2433, it may enter into a new downtrend and then its next support level at...


