
Trend Matrix
Don’t you love spending hours analyzing charts? No? Well, good thing we created Trend Matrix!
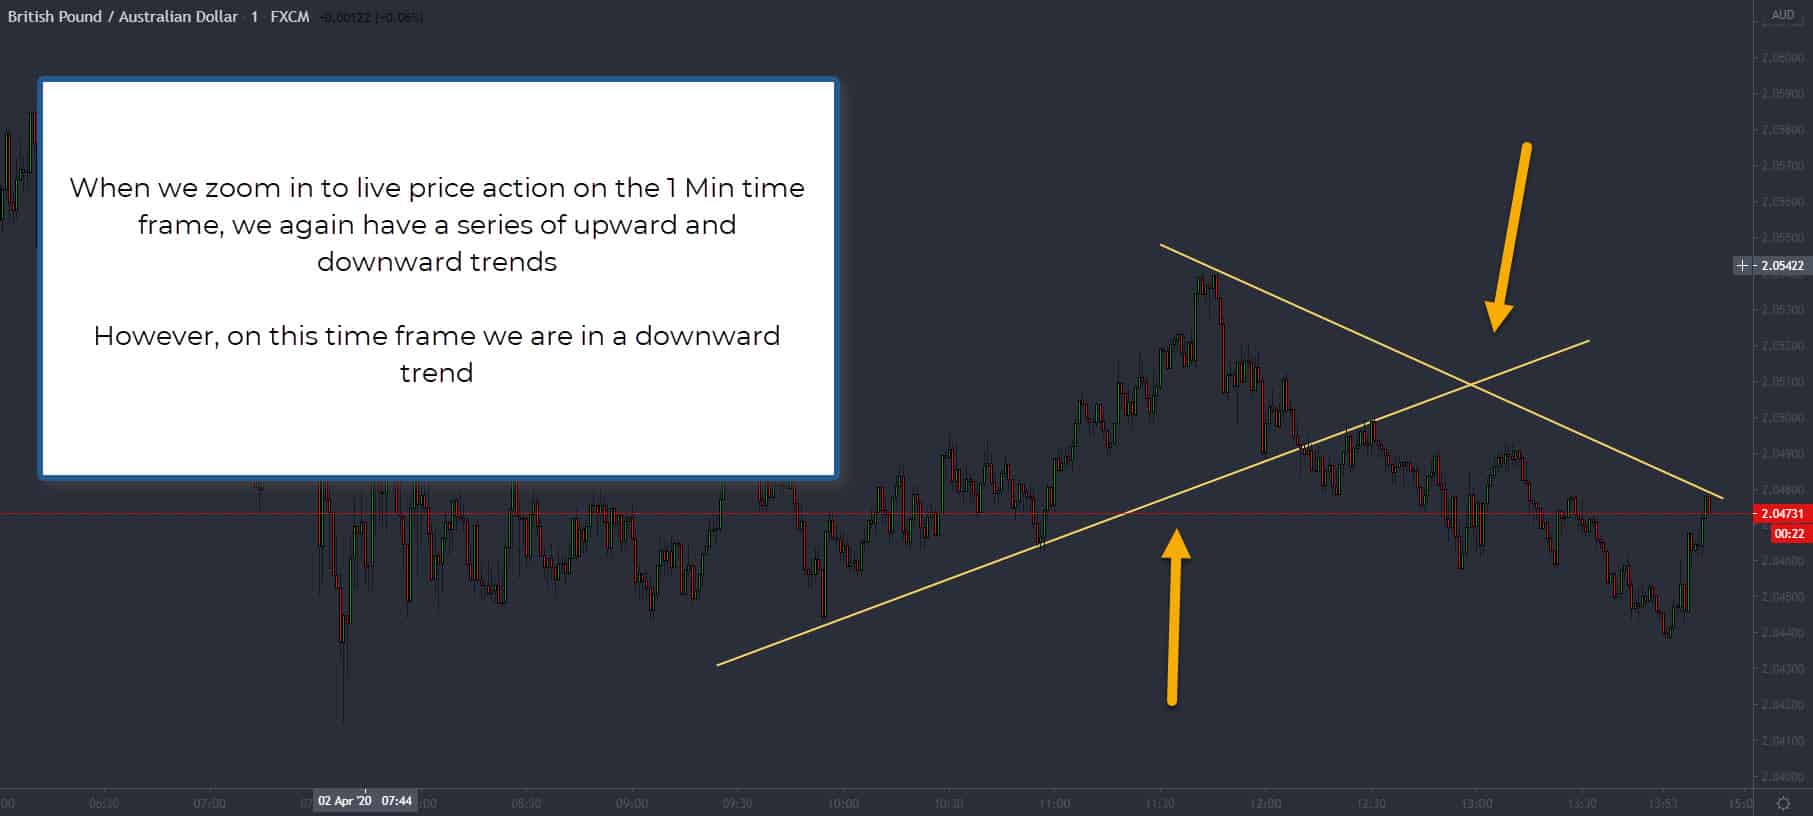
Trends within Trends
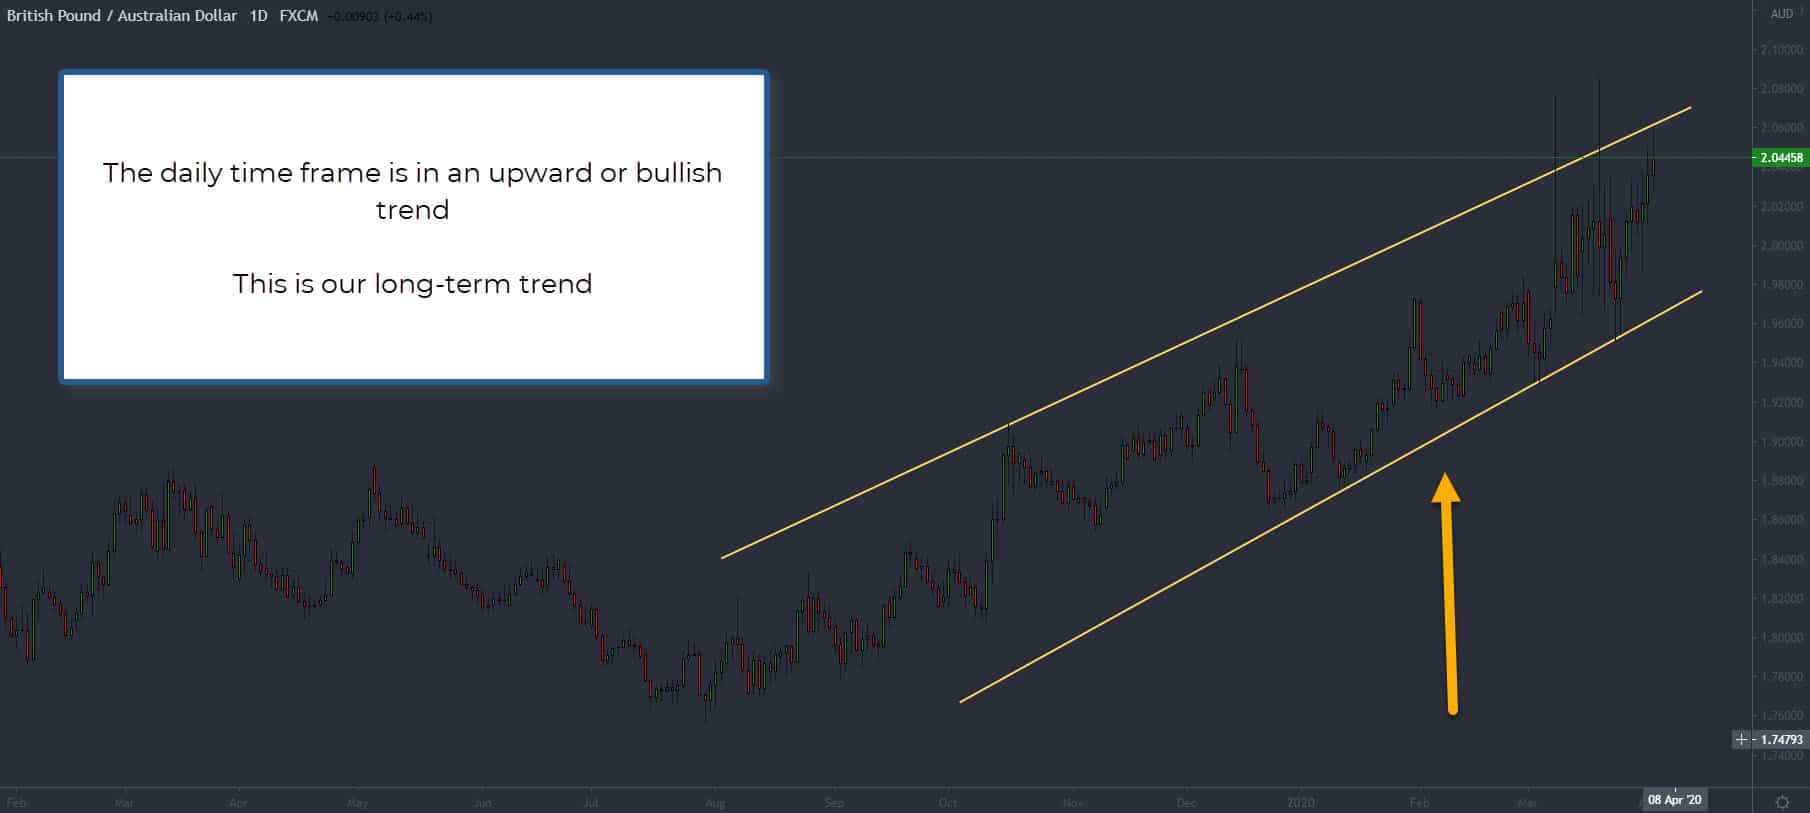
The Forex market is in constant cycles of trends in different time frames (or trends within trends). Most traders talk about “trading with the trend”, but what does that mean? In general terms, trading with the trend is trading in the same direction as the long term trend or primary trend.
Find Trend Trades: Finding an entry is as easy as waiting for a shorter time frame to over-extend (+8 or greater or -8 or less) in the opposite direction of the primary trend and entering a trade back in the direction of the primary trend. Explained another way: wait for a correction or consolidation against the primary trend to over-extend, then open a trade in the direction of the primary trend. Still confused? If the primary trend is upward (bullish), wait for a downward (bearish) correction or consolidation to over-extend, then open a buy/long position back in the direction of the upward (bullish) trend.
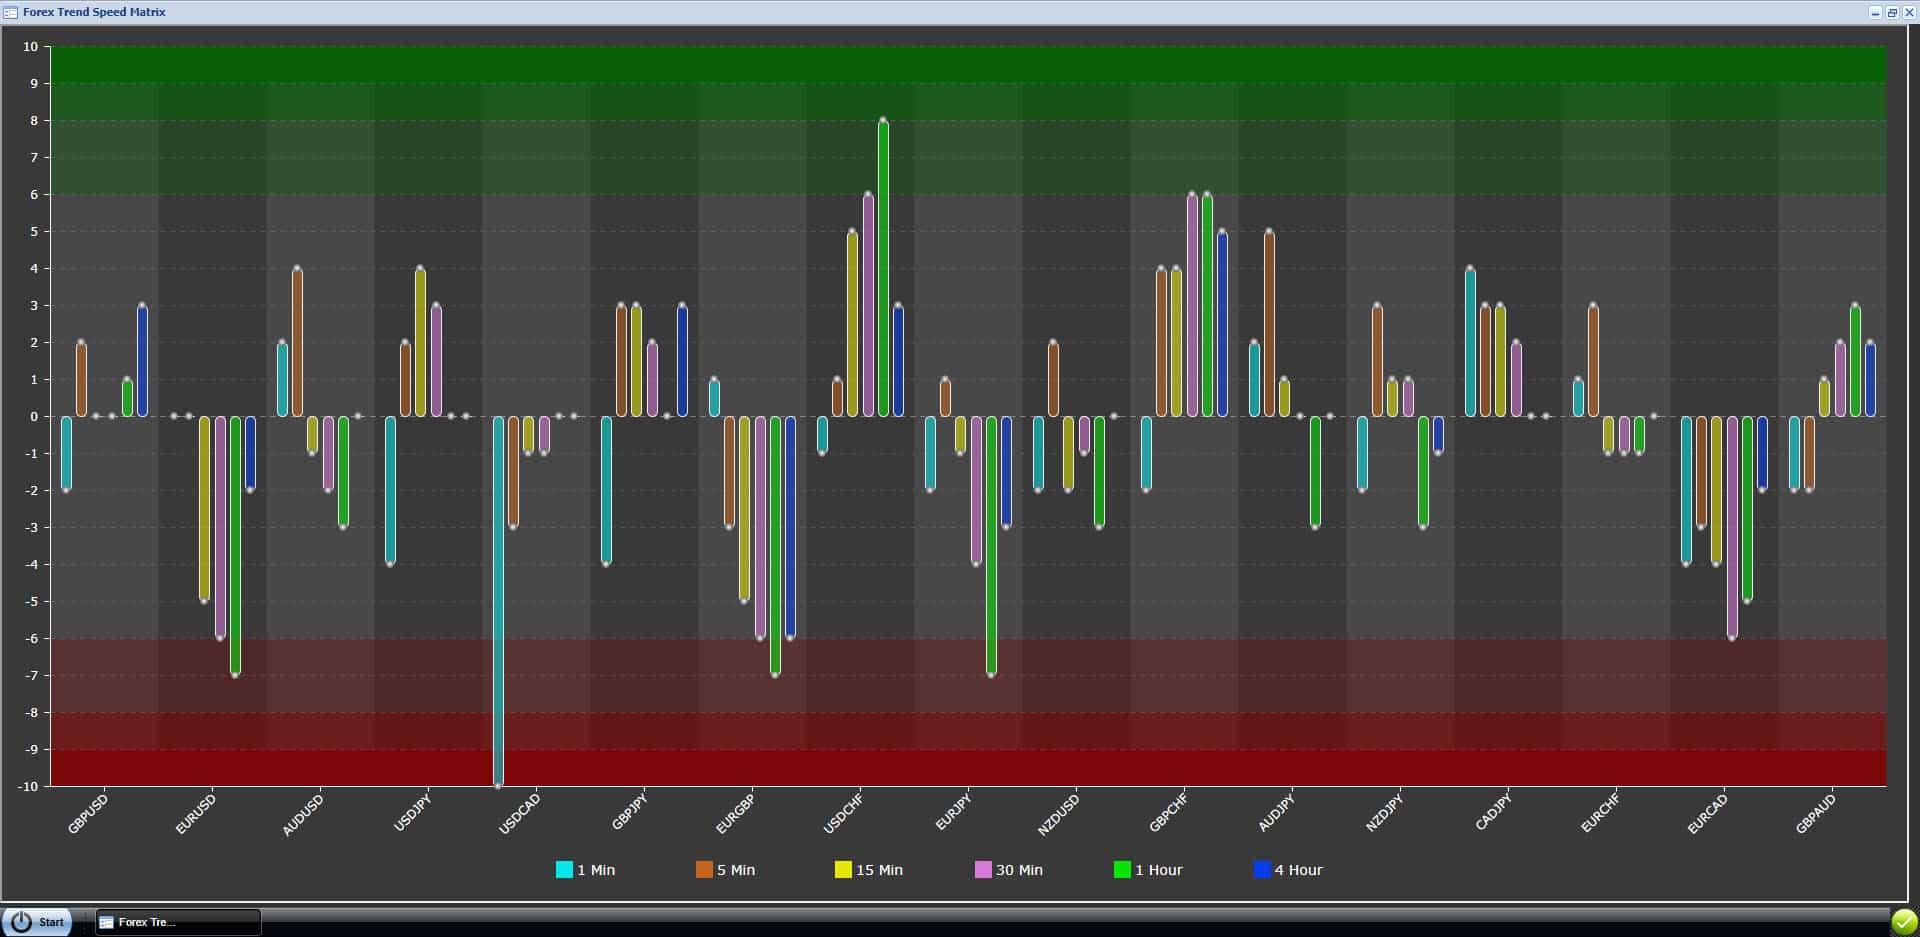
DO NOT over complicate this tool. The concepts behind the tool are complicated, but using the tool is not. If the values are positive, the market (in that time frame) is long or going up. If the values are negative, the market (in that time frame) is short or going down. Simple and powerful.
Trends within Trends Examples
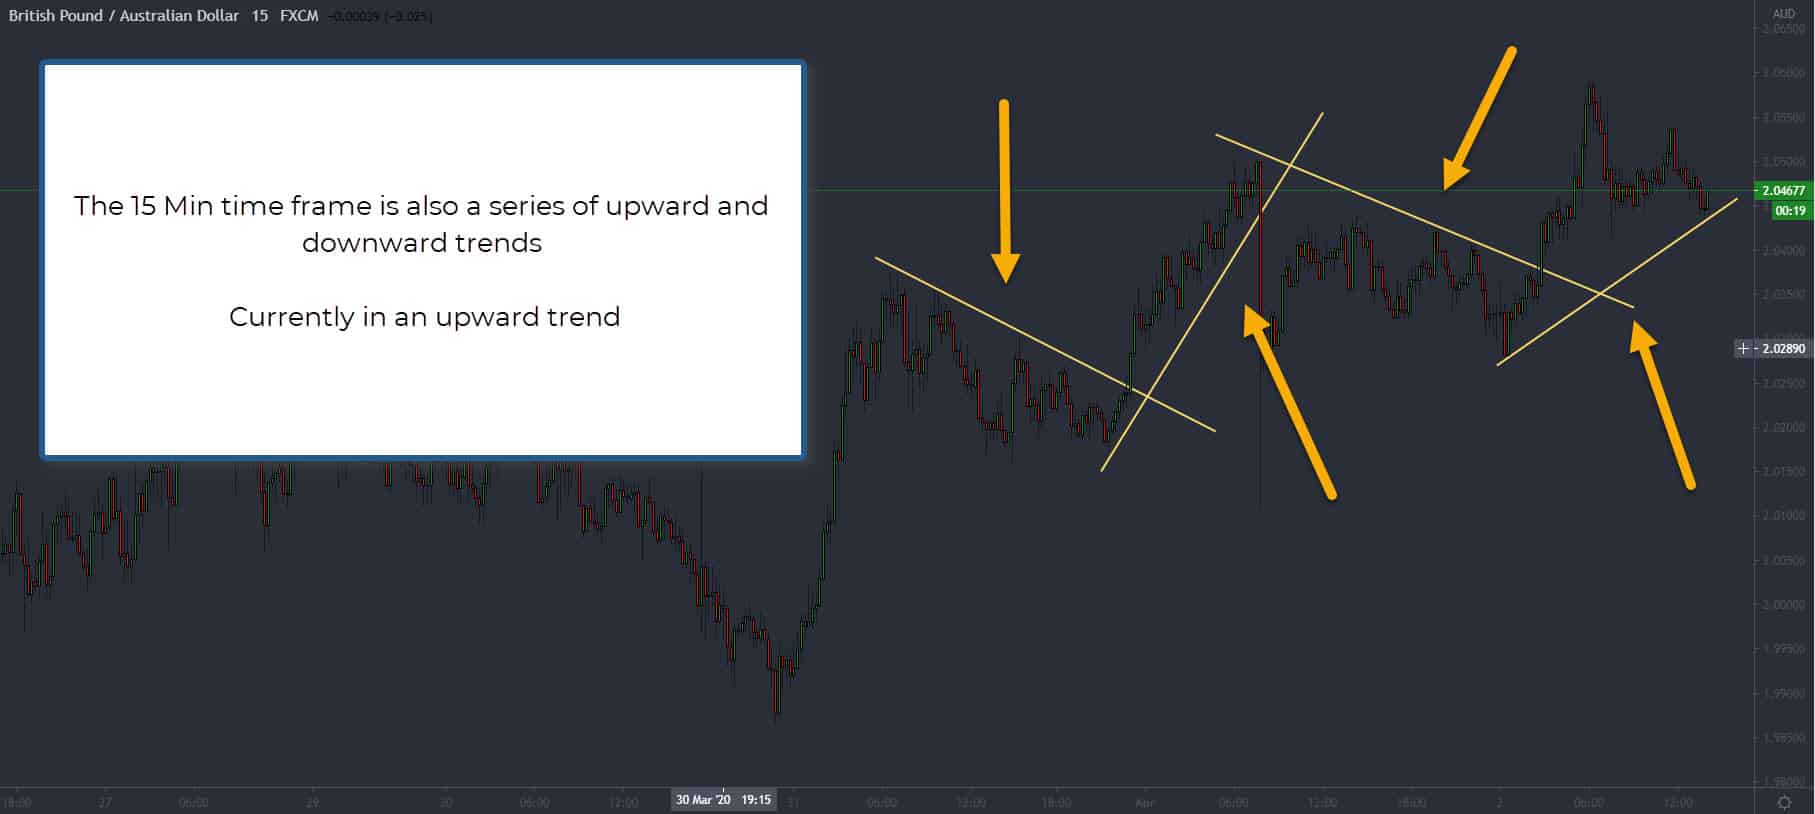
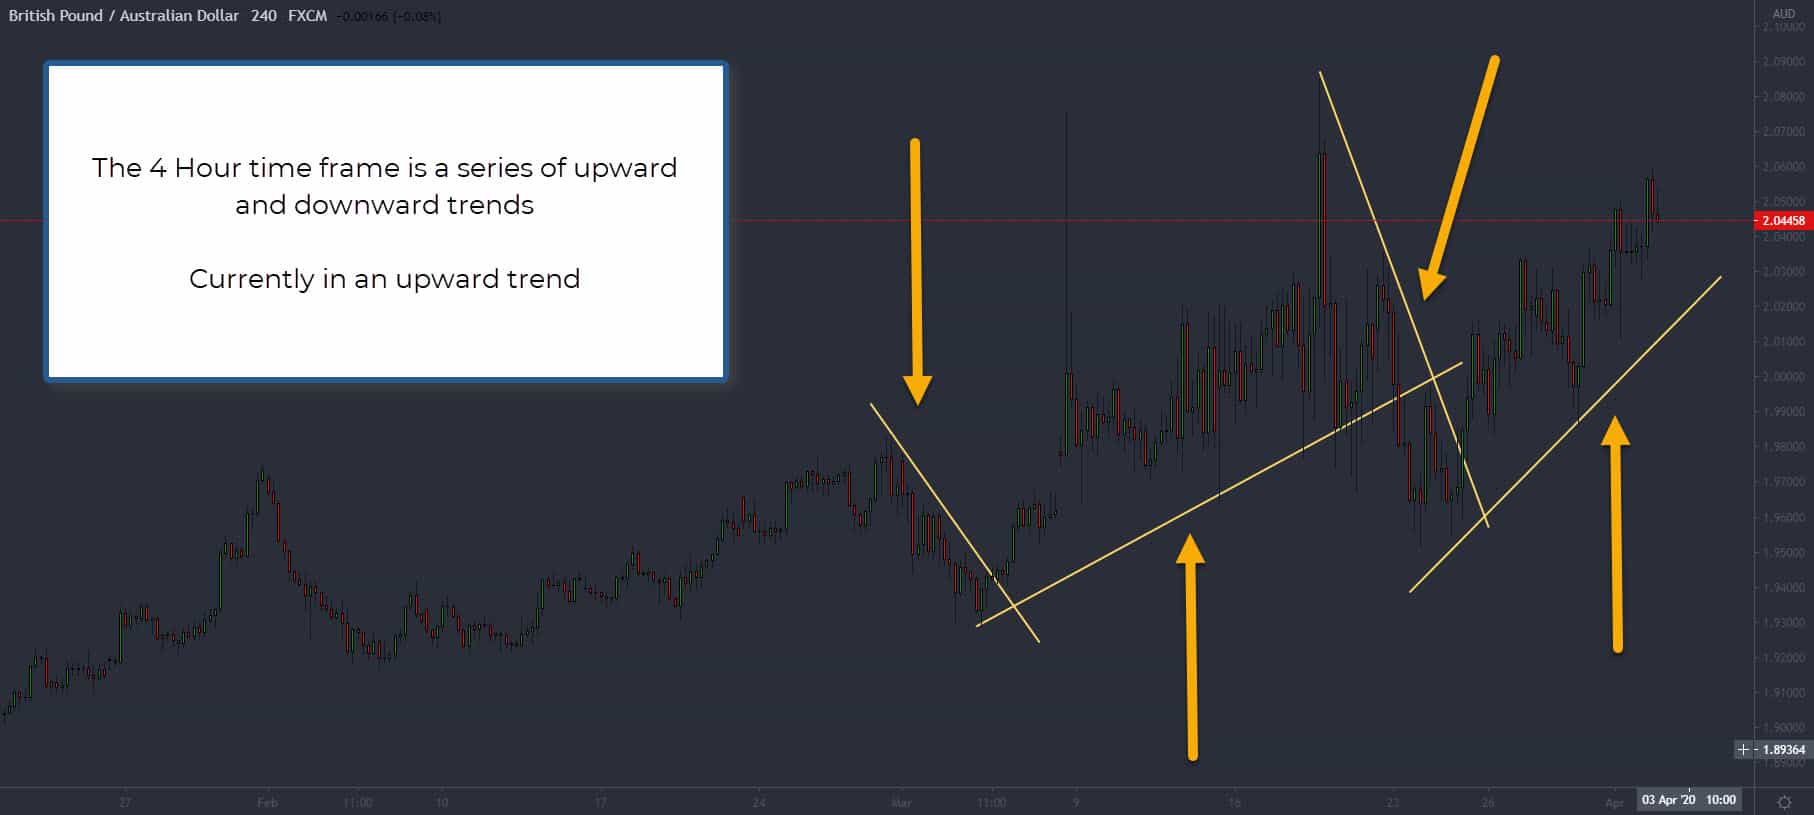
Our Trend Matrix does all of the work for you, but it’s still important to understand the basic concept. The following illustrations explain how trends form in different time frames and how we can use this to find trades.
Time Frames
The Trend Matrix dashboard calculates trend data for 6 time frames and displays the data as a vertical bar. You can monitor 17 currency pairs at the same time! Imagine opening 17 different charts and scrolling through 6 different time frames (all in real-time) to find a trade. Aren’t you glad you have Trend Matrix?
- 1 Min – This is considered live price action or real-time prices.
- 5 Min – Ideal for high frequency traders and timing exits or entries on longer trades.
- 15 Min – Perfect for Day Trading or trades that last 1 to 2 hours.
- 30 Min – Great for Swing & Day Traders, and to understand how trends are cycling.
- 1 Hour – This time frame is best suited for Swing Traders and to understand how trends are cycling.
- 4 Hour – Use this as your primary or long term trend direction.
NOTE: We suggest trading in the same direction as the 4 Hour trend, unless you are scalping a short term correction.
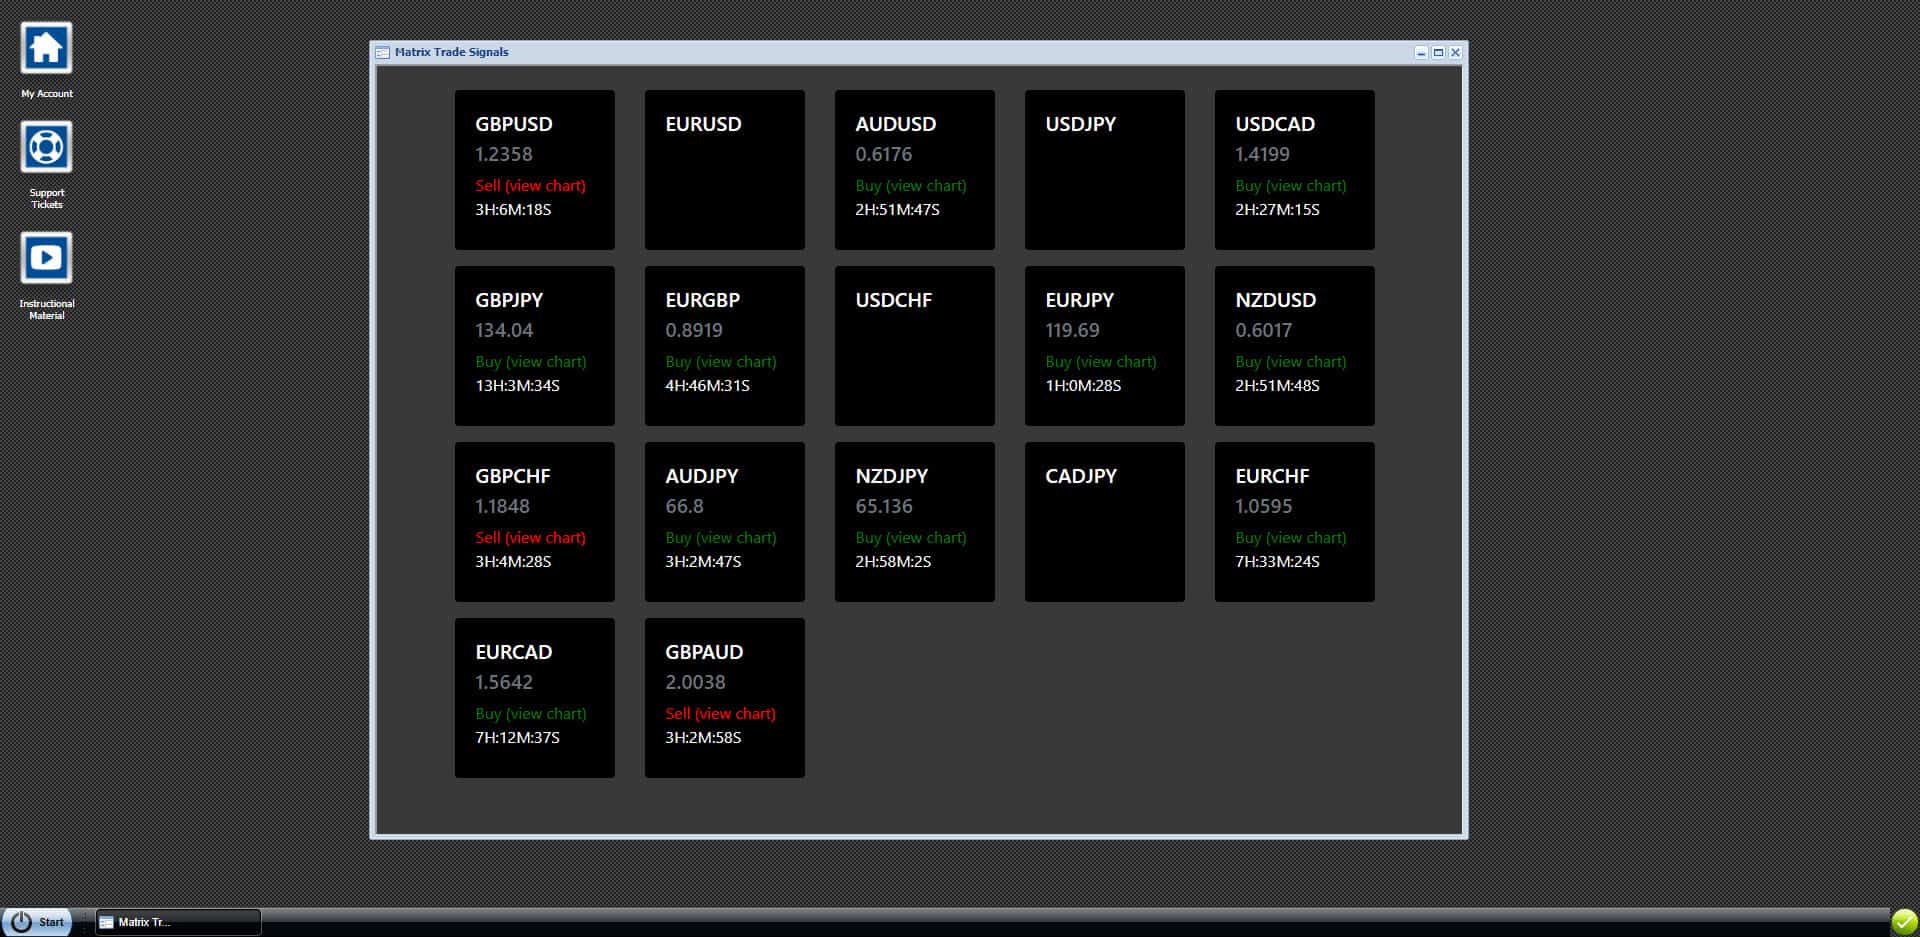
Better Matrix Trade Signals
A very simple and powerful way to increase your profits with our Matrix Trade Signals is to follow the 4 Hour trend direction. Only take trades in the direction as the 4 Hour. If the 4 Hour data is positive (above zero) only take buy/long signals. If the 4 Hour data is negative (below zero) only take sell/short signals.
NOTE: we plan to add this feature to our Matrix Trade Signals in the future.