
Currency Matrix
Our Currency Matrix trading tool is the core of all of our tools. As soon as you understanding how our Currency Matrix works, our other trading tools will make sense. The basic concept is pretty simple. Understand the relationship between a currency pair’s Base and Quote is key.
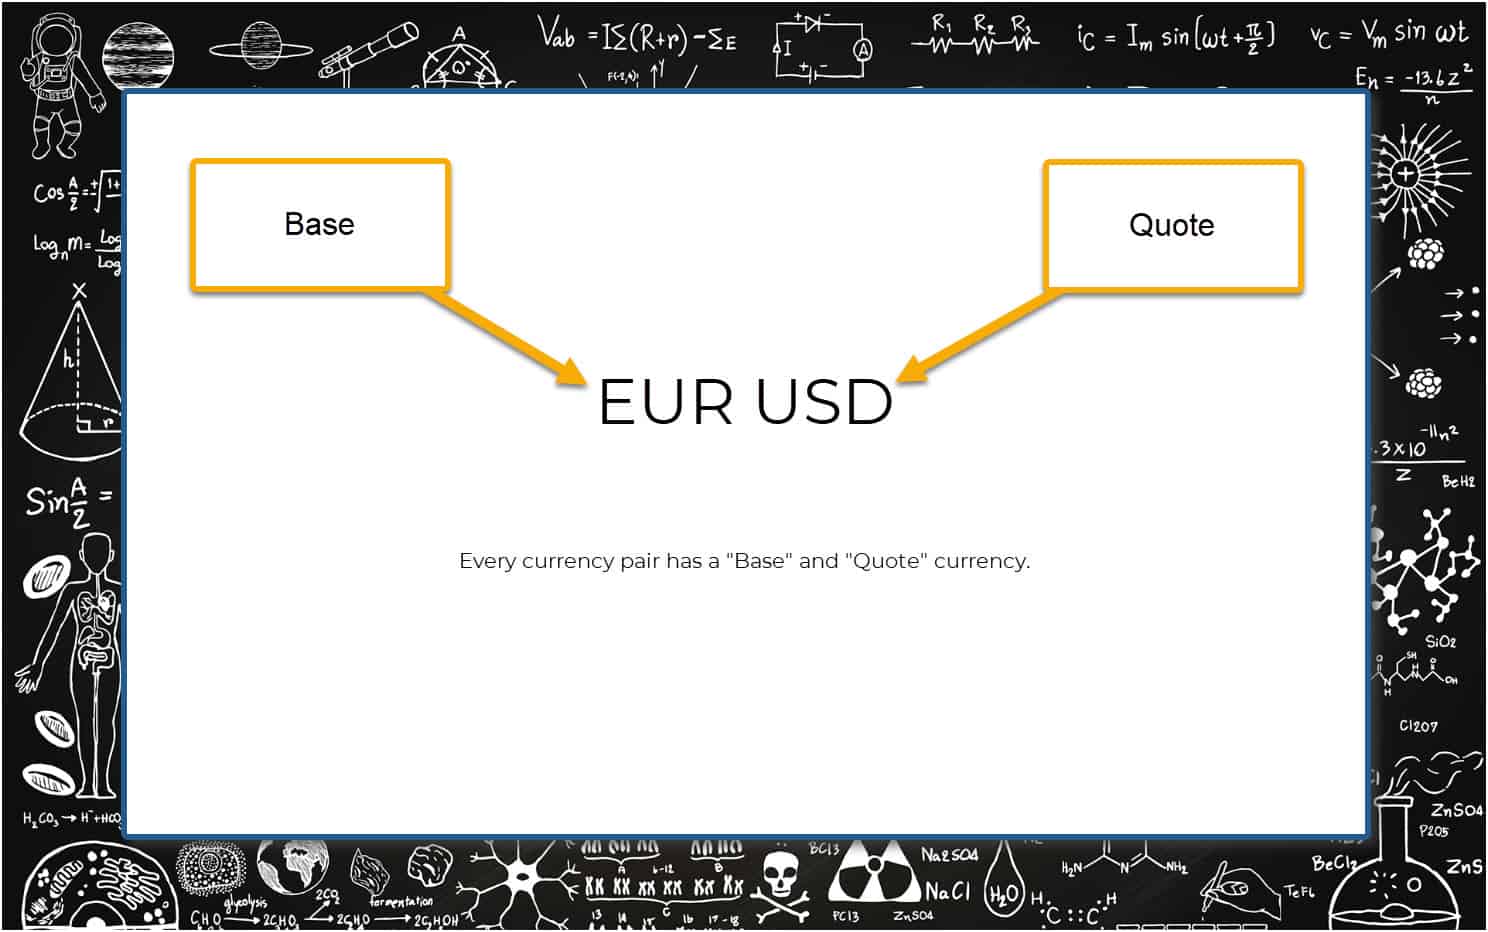
The Base and Quote
Currencies on the Forex market are always traded in pairs. In order to find out the relative value of one currency, you need another currency to compare. When you buy one currency, you automatically sell another currency. Example: when we sell the EURUSD, we are selling the EUR and buying the USD at the same time. If we buy the EURUSD, we are buying the EUR and selling the USD at the same time.
Currency Pair: A currency pair is the quotation of two different currencies, with the value of one currency being quoted against the other. The first listed currency of a currency pair is called the base currency, and the second currency is called the quote currency. Currency pairs compare the value of one currency to another—the base currency (or the first one) versus quote currency (or the second one). The live price indicates how much of the quote currency is needed to purchase one unit of the base currency.
Using the Base and Quote
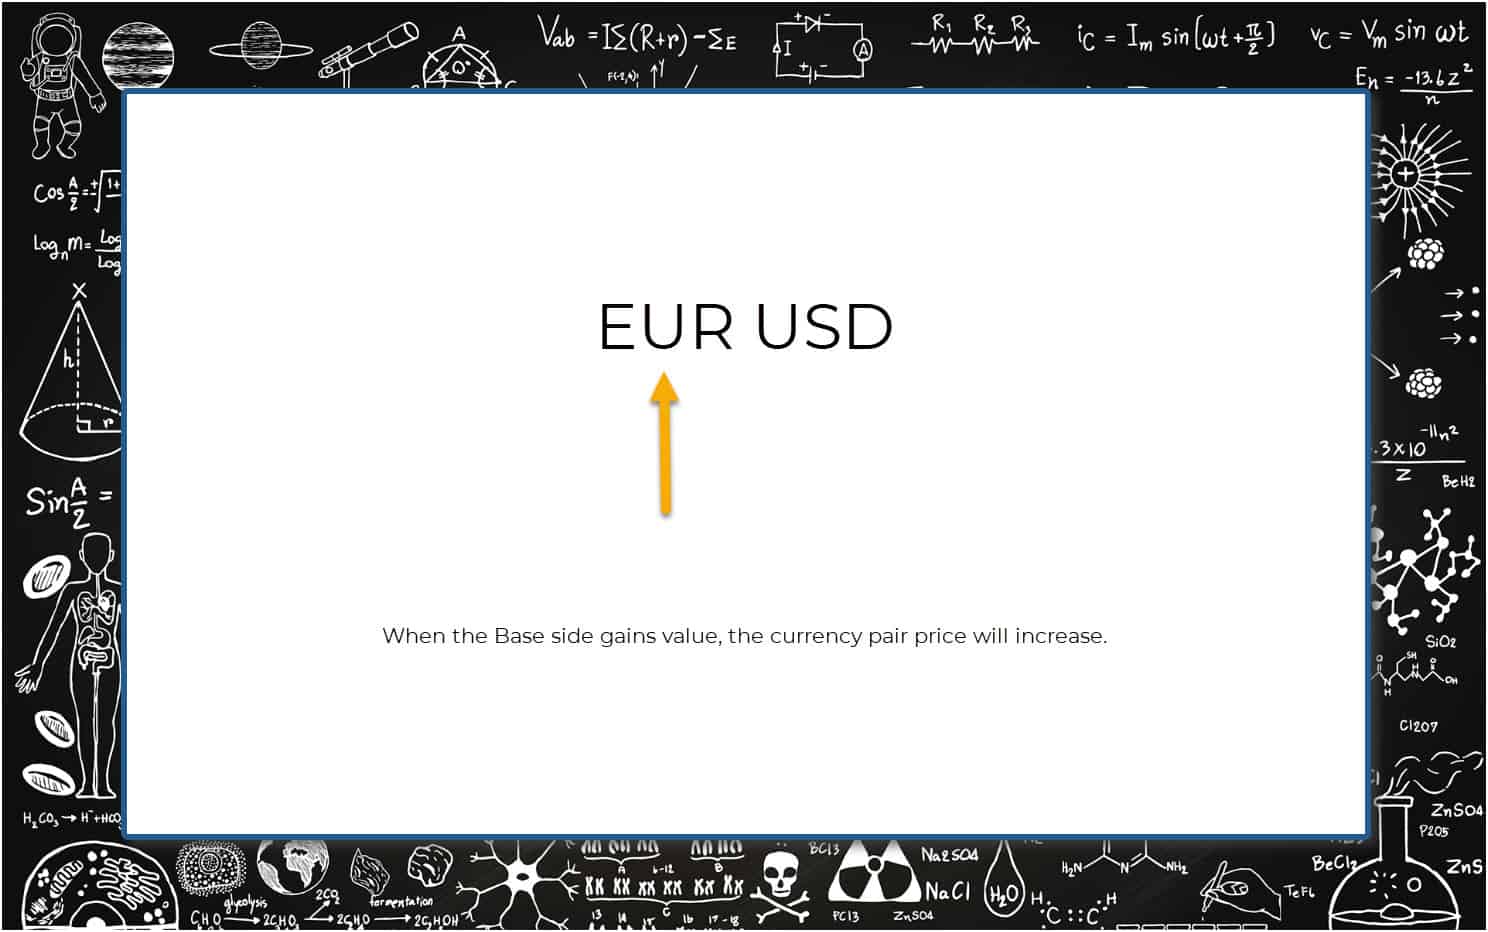
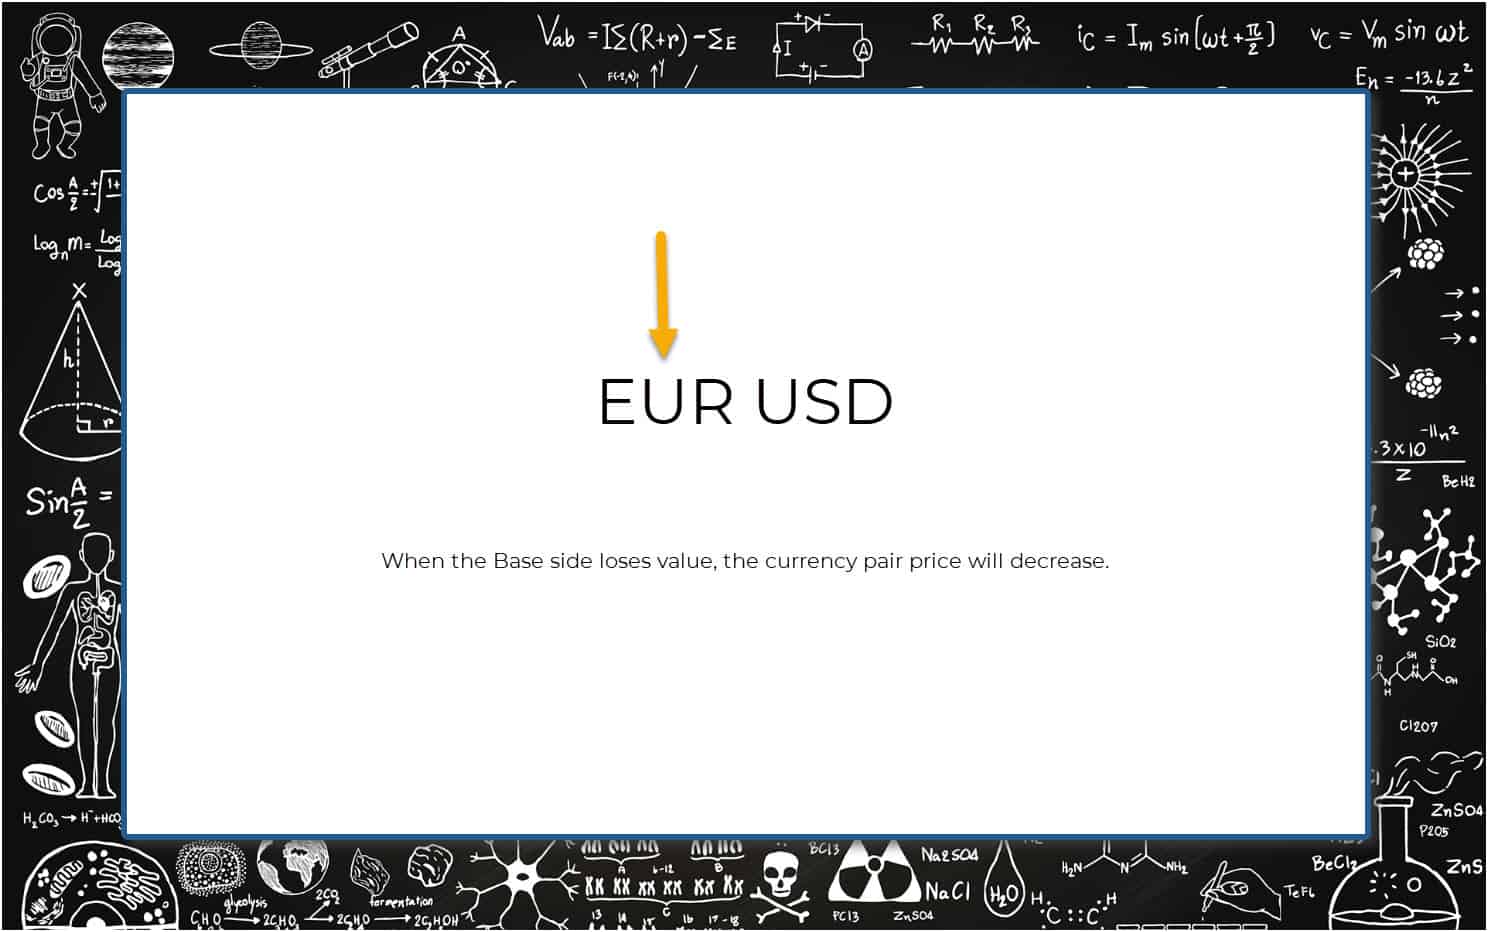
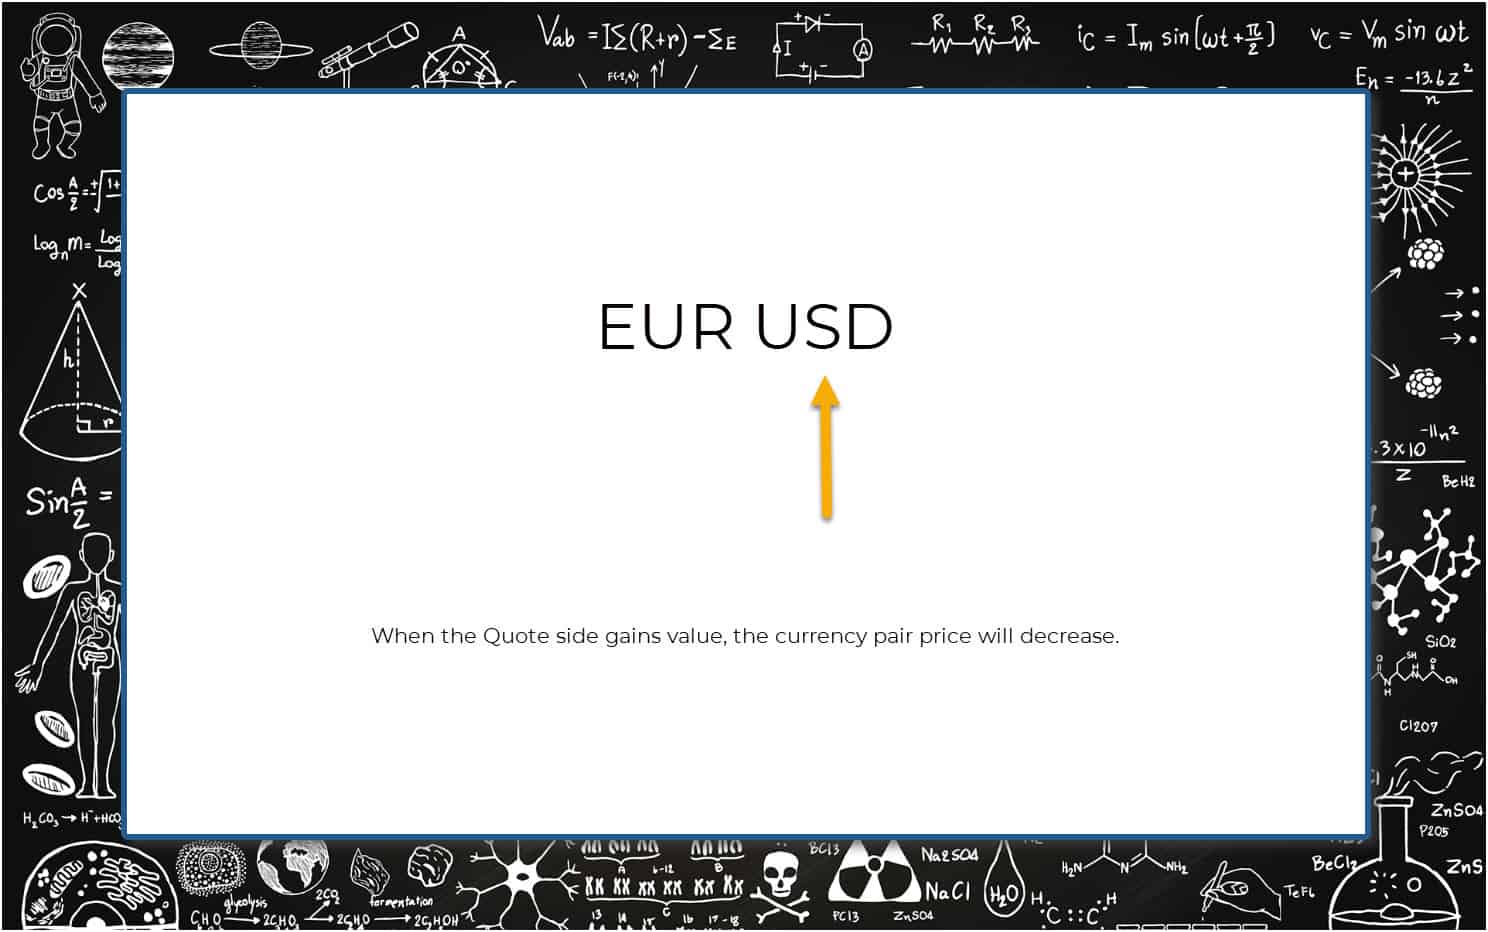
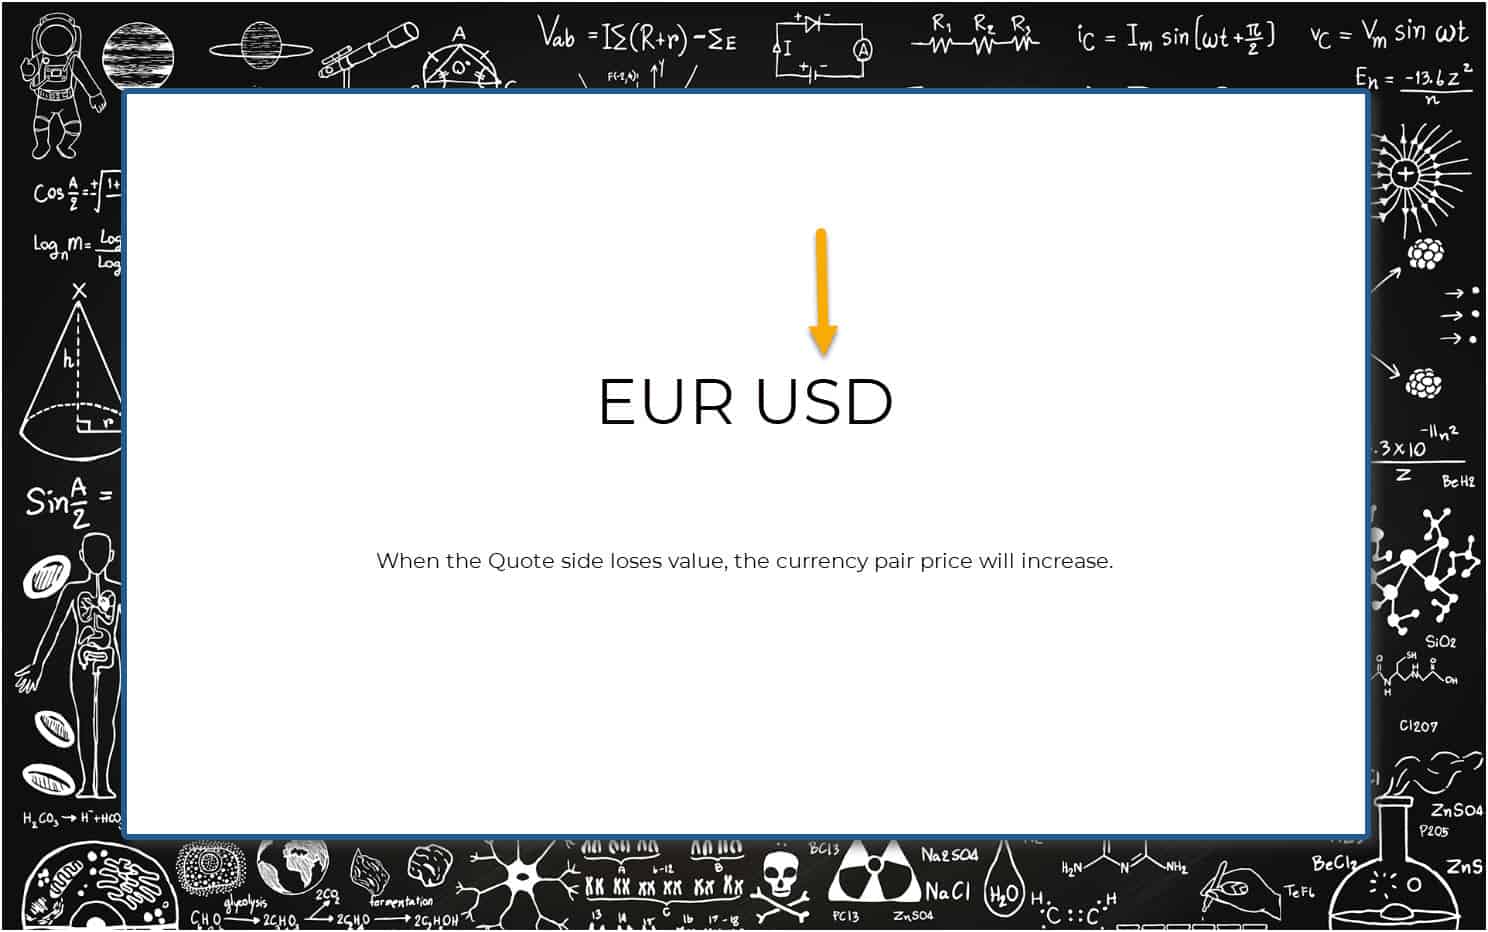
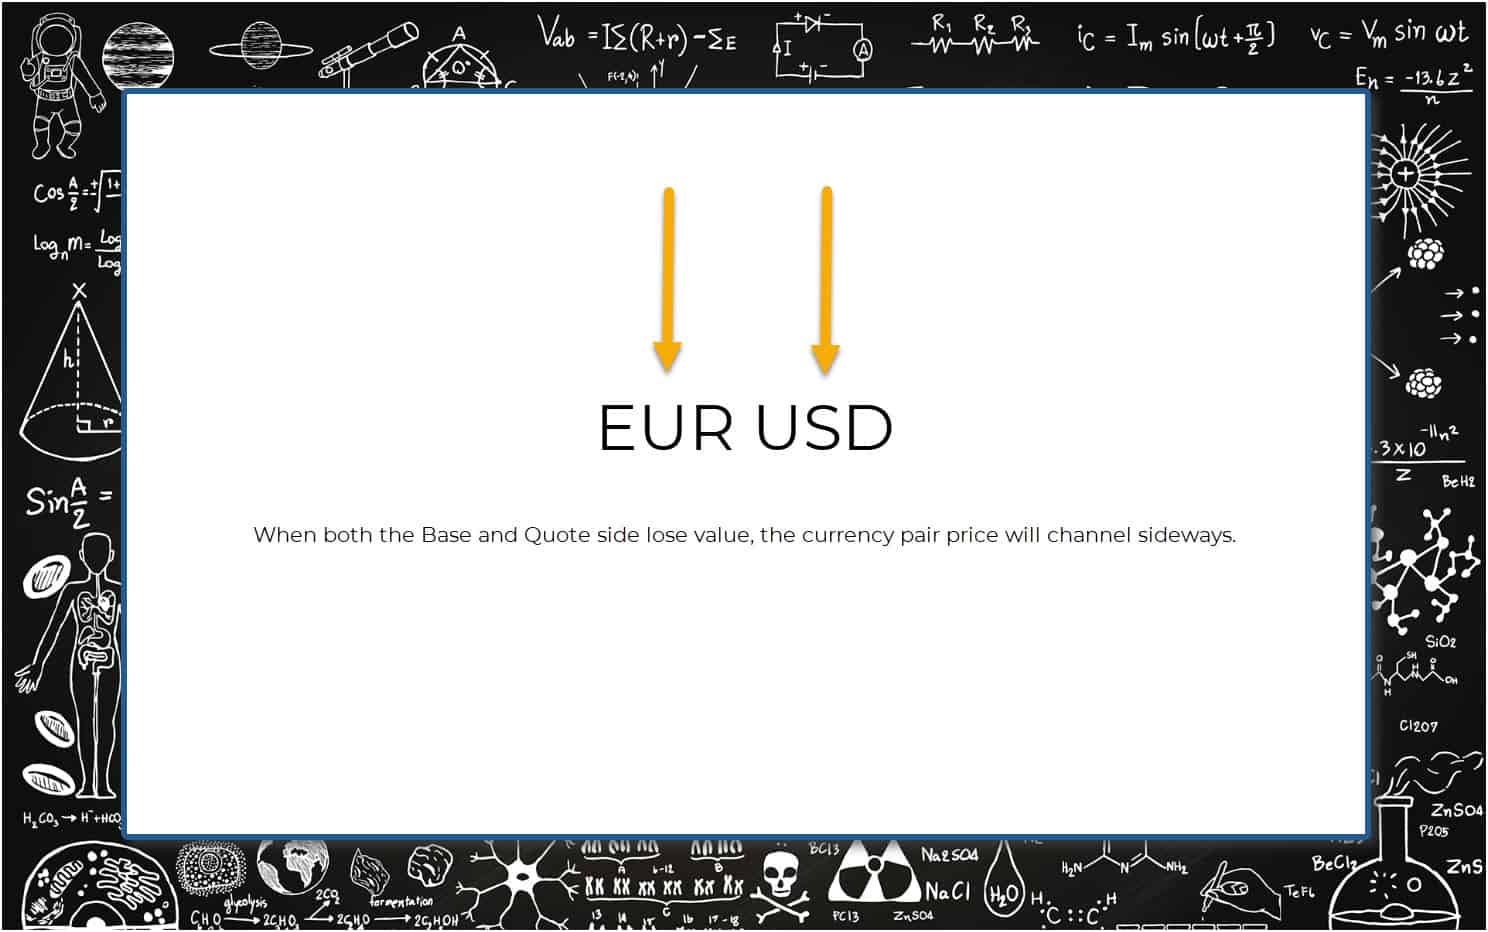
Standard charting provides the price (value) for each Forex pair. Our Currency Matrix separates pairs into their Base and Quote components. We can use this data to determine which side of the currency is driving a price move and if that side is over-extended (but we’ll get to that later). For now, let’s just focus on the relationship between the Base and Quote so we can understand how they affect each other. Please scroll through the images below (6 in total).

Time Frames
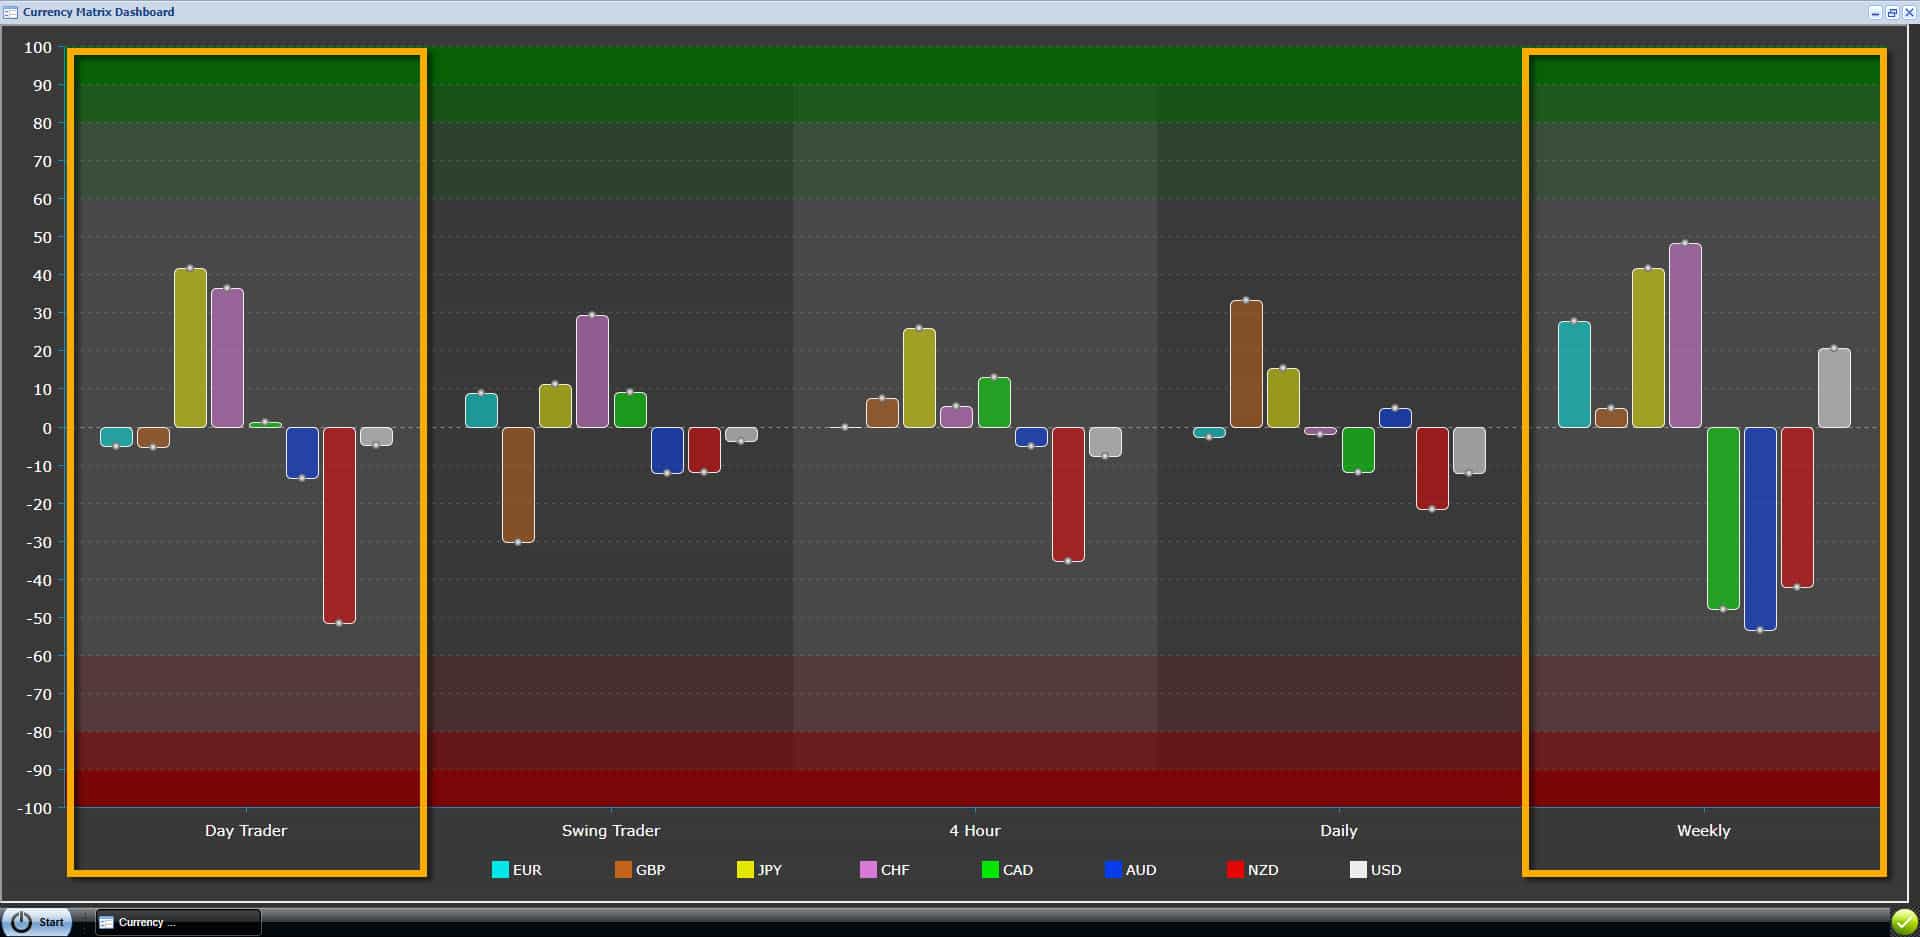
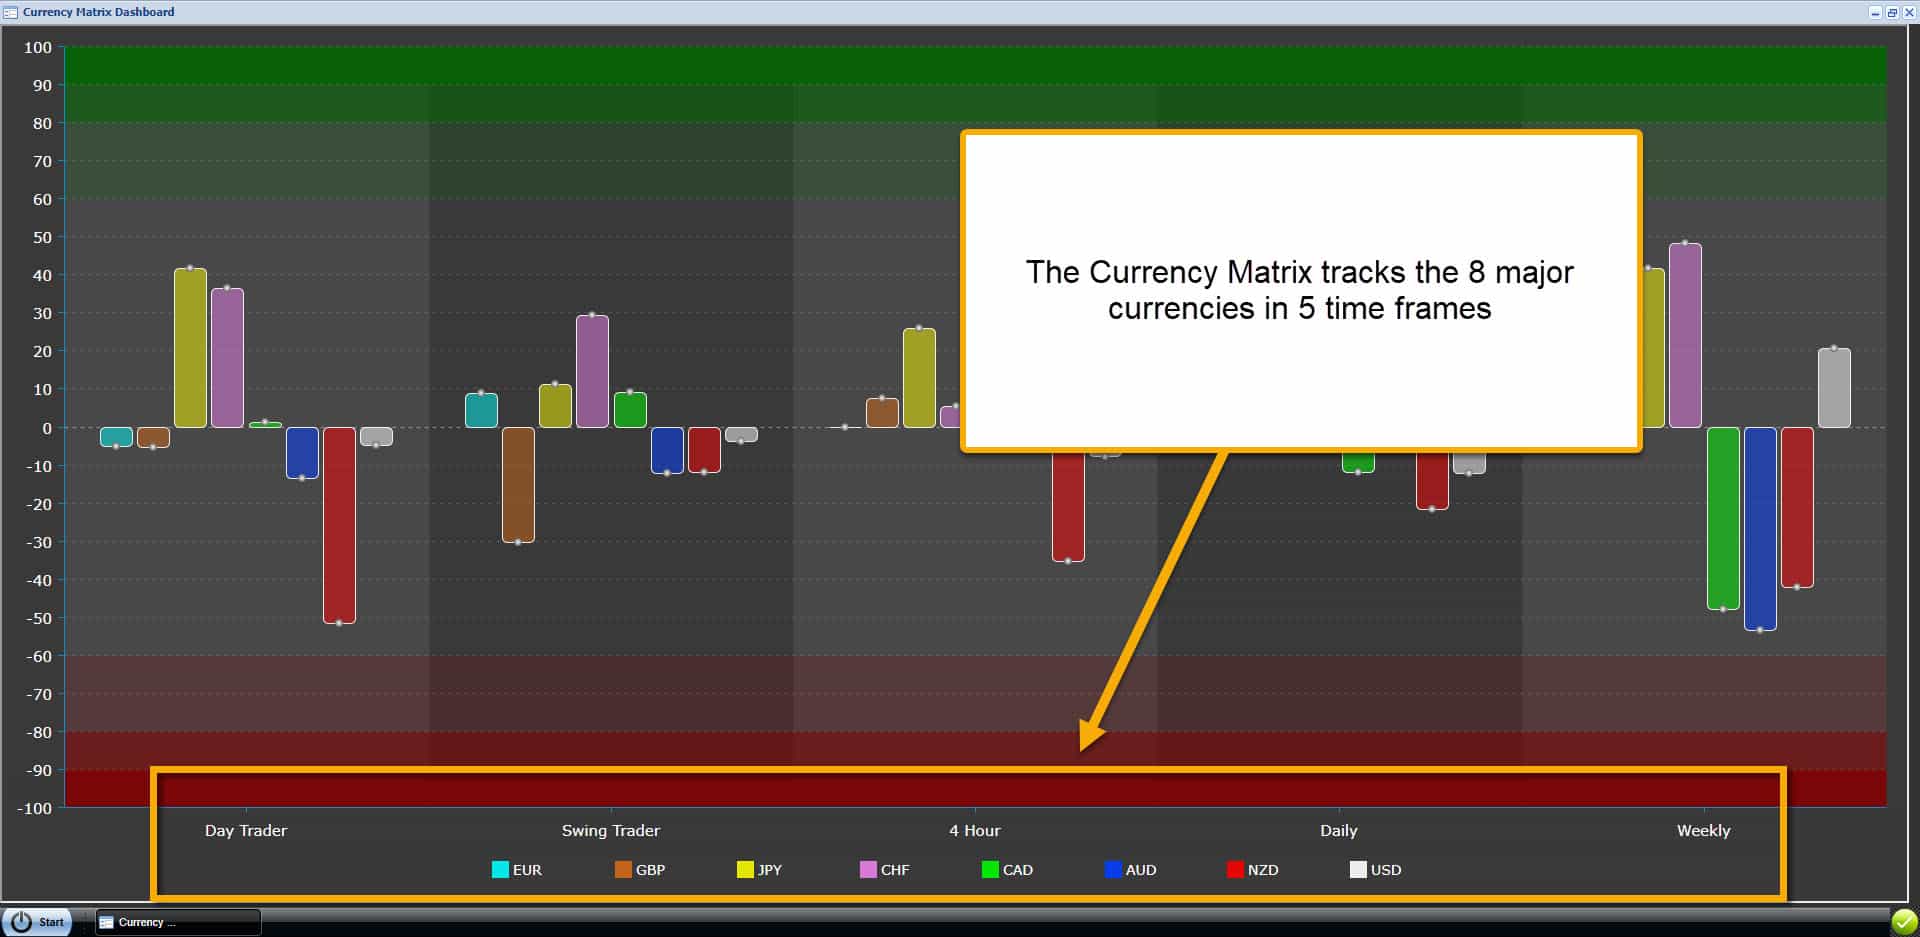
Our Currency Matrix calculates data for 5 time frames. The time frame increase in value from left to right are are as follows:
- Day Trader – This is shortest time frame and is an average of the 5 Min and 15 Min time frames.
- Swing Trader – This is an average of the 30 Min and 1 Hour time frames.
- 4 Hour – All of the data is pulled from a 4 Hour time frame.
- Daily – All of the data is pulled from a Daily time frame.
- Weekly – All of the data is pulled from a Weekly time frame.
NOTE: never time a trade entry based on the Daily or Weekly time frames. These time frames are only provided for long term trend analysis. However, always trade in the direction of the Daily and Weekly time frames.
Time Frame Values
The value range is displayed as +10 to -10. A value greater than 0 is strength, and a value less than 0 is weakness. The top and bottom of the range indicate an over-extension for that time frame. An over-extension is usually followed by a correction or consolidation.
+8 or greater = Over-Bought and needs to correct or consolidate (bounce down)
-8 or lower = Over-Sold and needs to correct or consolidate (bounce up)
Using the Currency Matrix
Our Currency Matrix displays data from the 8 major currencies (not currency pairs). We can use this data to determine all of the following and more:
- Trend Direction (see the image examples below)
- Trend Strength (trends established on larger time frames are stronger)
- Trend Speed (strong trends on shorter time frames, relative to longer times will determine trend speed)
- Which side of the pair is driving the trend (see the image examples below)
- When a trend requires a consolidation or correction (see definition below)
Trend Consolidation – A consolidation occurs when one side of a currency pair is over-extended. Periods of consolidation can be found in Forex price charts for any time interval, and these periods can last for days or months. Consolidations typically form patterns: descending channel, ascending channel, sideways channel, flags, triangle, etc…
Trend Correction – A correction can also occur when one side of a currency pair is over-extended. A correction or, in other words, pullback, bounce, or retracement, is a relatively short-term movement of the Forex market in the direction opposite to the main trend. A correction will be bearish in a bullish trend, or bullish in a bearish trend.
Both a Trend Consolidation and Trend Correction begin with a price reversal after an established trend. In simple terms, when a price moves in the same direction for a long period of time (relative to the time frame that you are trading from – there are trends within trends, but we will cover that in our Trend Matrix page), eventually the trend will run out of momentum, and the market will move in the opposite direction. When the market reverses after an over-extension, this is a correction. When the market forms a pattern after a correction, this is a consolidation.

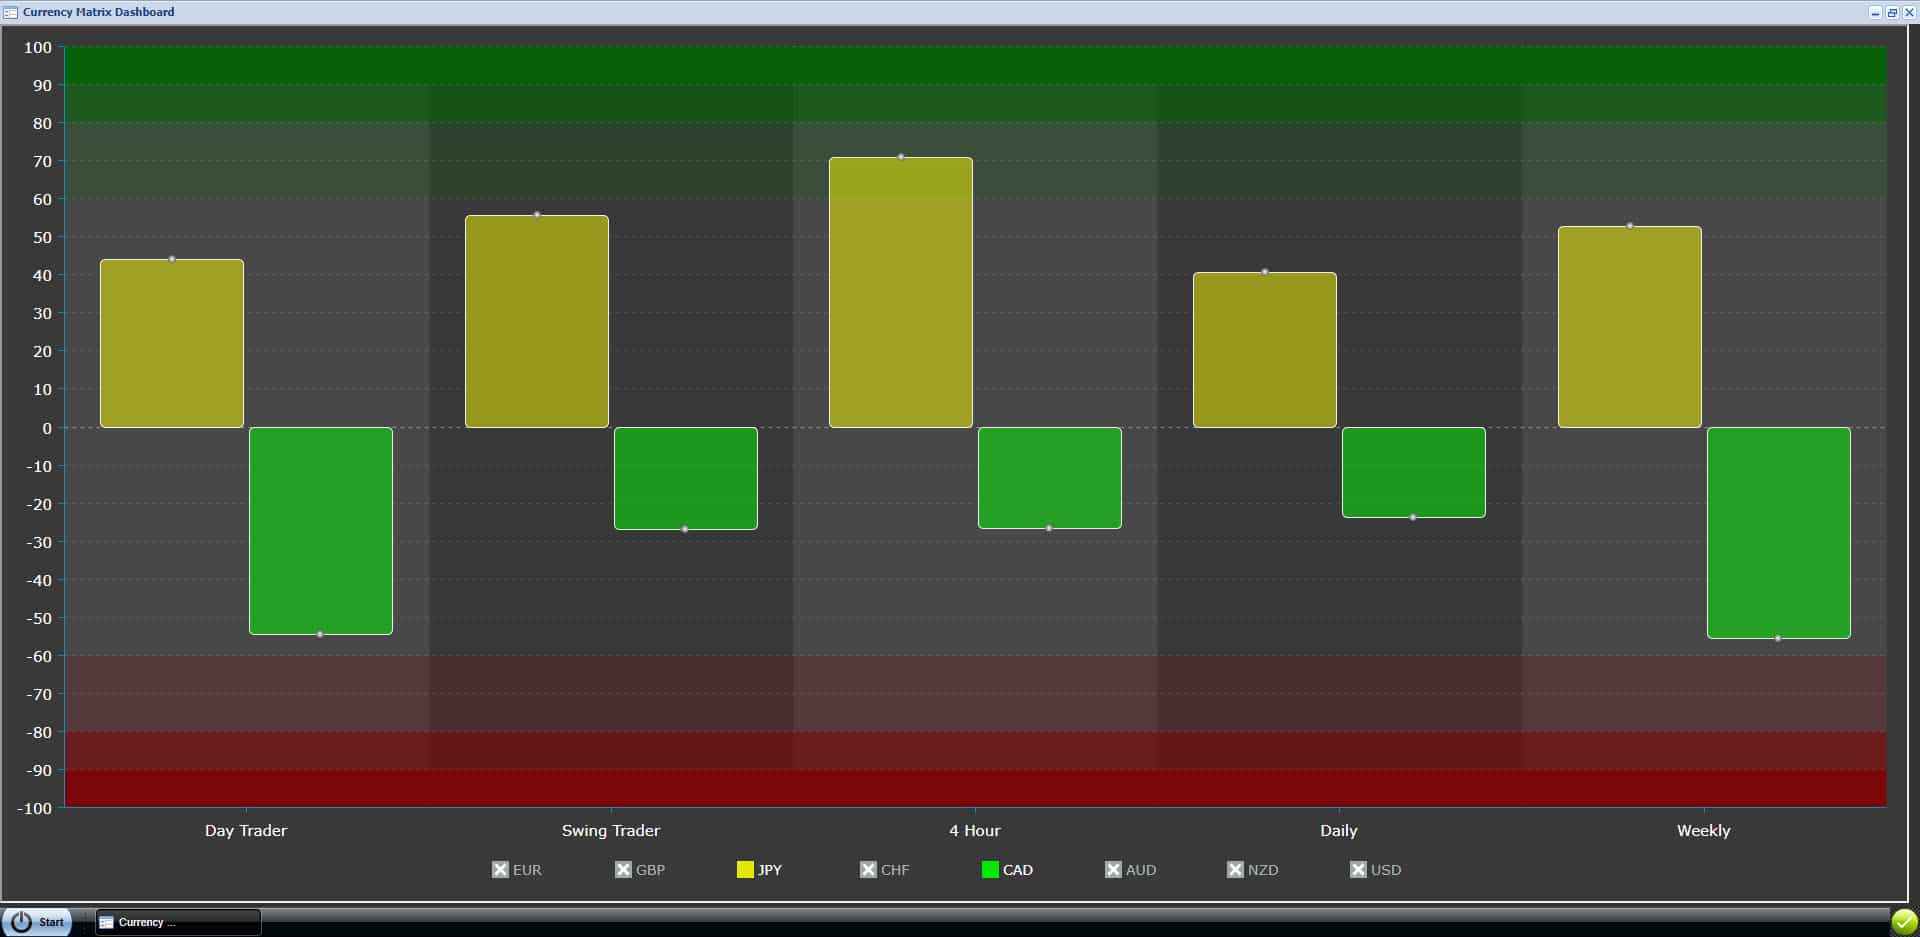
USDCHF
The CHF is mostly stronger than the USD on all time frames, so this pair is bearish. The middle time frames have low values, and this tells us that the USDCHF is in the middle of a correction or consolidation. The USD in the shortest time frame (Day Trader) is getting close to being over-extended. We want to sell this pair, but we need to wait for a bullish pull-back on the Day Trader before we enter.
CADJPY
The JPY is stronger than the CAD in every time frame. This indicates a very strong bearish (downward) trend—the 4 Hour JPY is beginning to over-extend, but still has room to run. Based on current conditions, we would only sell this pair. However, If the JPY reaches 8+ on the 4 Hour time frame, we will consider a correction relative to the 4 Hour time frame.

NZDJPY
The JPY is stronger than the NZD in every time frame. This indicates a very strong bearish (downward) trend—the Day Trader JPY is beginning to over-extend, but still has room to run. Based on current conditions, we would only sell this pair. However, if the JPY reaches 8+ on the Day Trader or other time frame, we will consider a correction relative to that time frame.
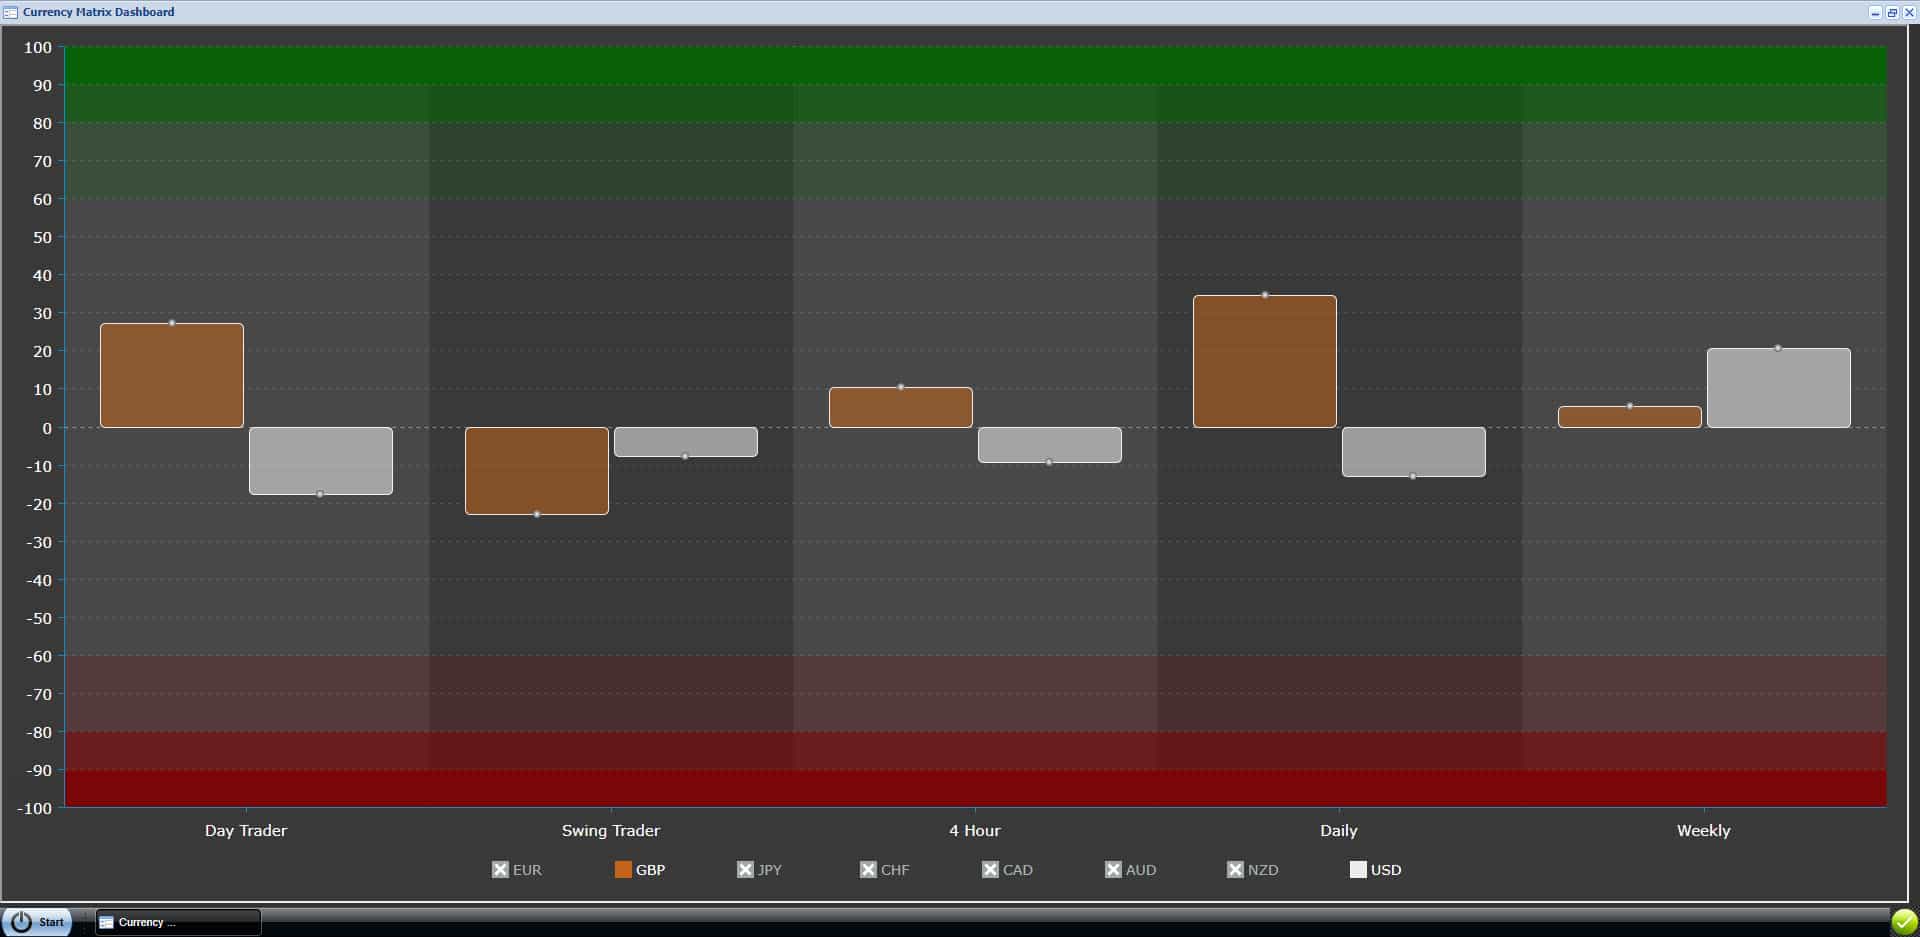
GBPUSD
The GBP is mostly stronger than the USD in every time frame. The USD is stronger in the Swing Trader time frame. The pair is bullish, and it just finished a small correction and is beginning to trend up again. We know this because the Day Trader is bullish, but the Swing Trader is bearish, and the 4 Hour is still bullish. The correction wasn’t strong enough to change the 4 Hour, and Swing Trader is contracting back to bullish.
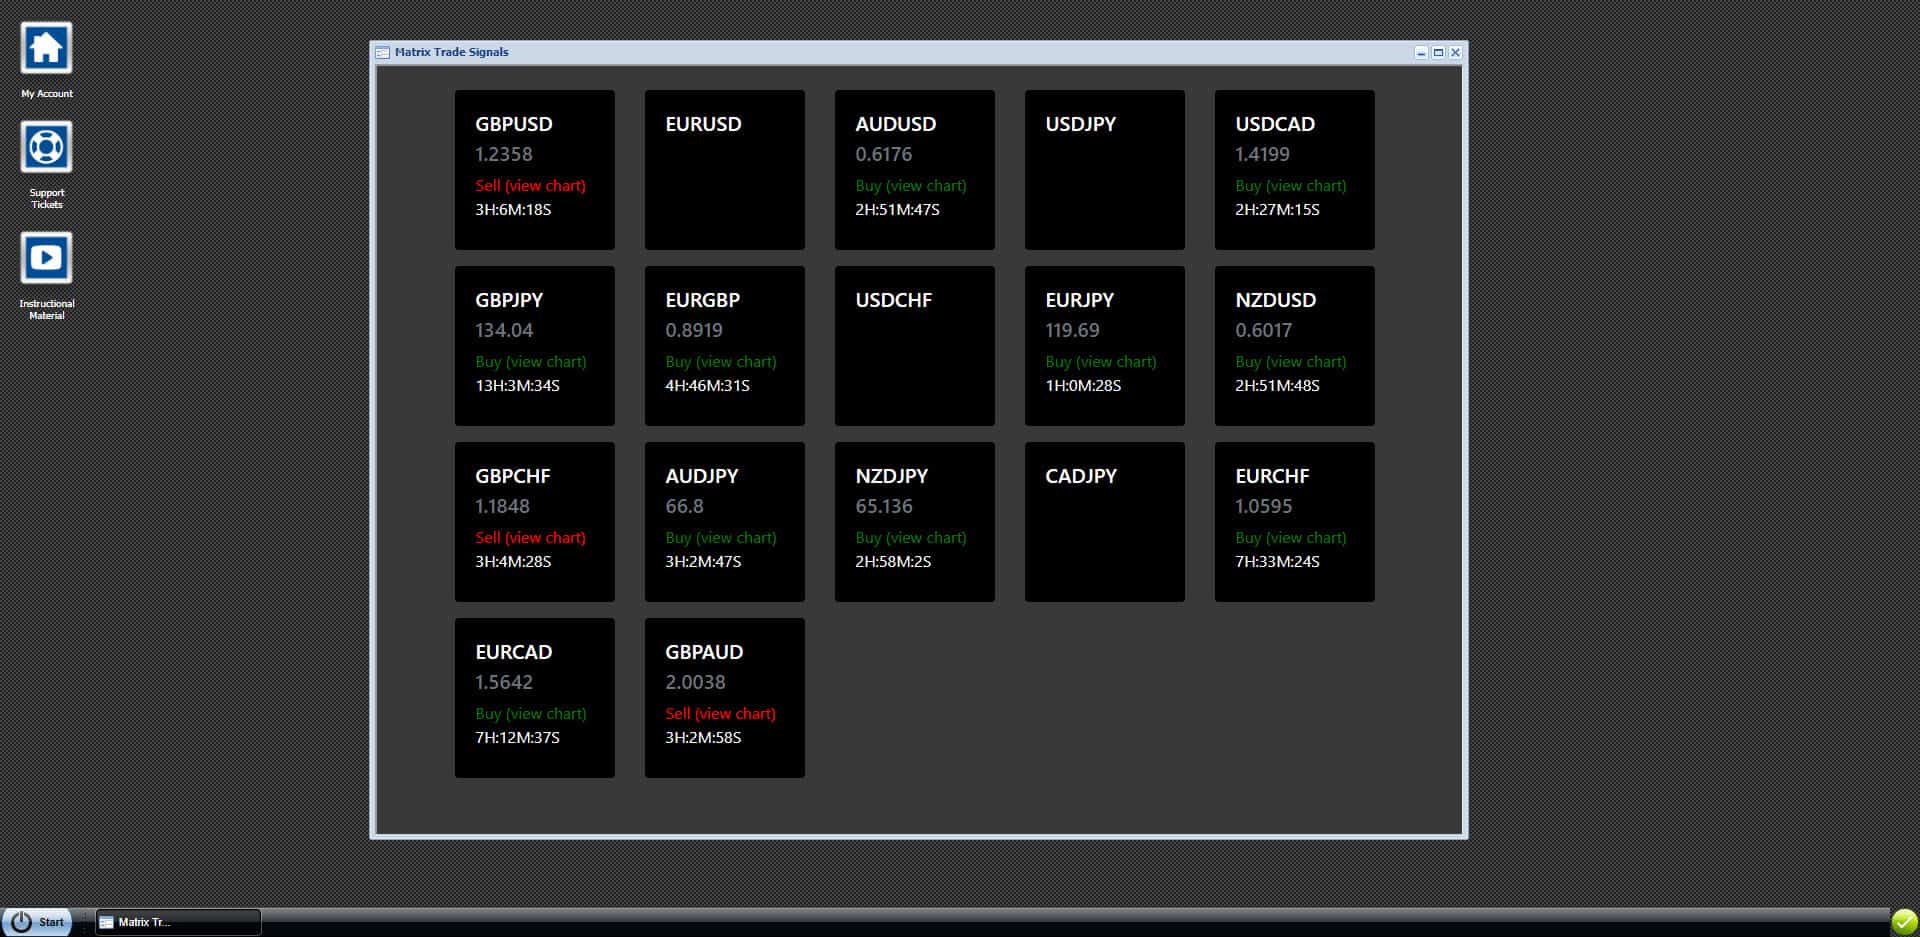
Better Matrix Trade Signals
A very simple and powerful way to increase your profits with our Matrix Trade Signals is to follow the Daily and Weekly time frames. Only take trades in the direction of the Daily and Weekly. When the Daily and Weekly are mixed (showing opposite trend information – this indicates a longer term consolidation or trend reversal), follow all of the signals sent.
NOTE: we plan to add this feature to our Matrix Trade Signals in the future.